Quantcast
Channel: Planet Python
Viewing all 22859 articles
Browse latest View live

Weekly Python StackOverflow Report: (cxcviii) stackoverflow python report

$
0
0

TechBeamers Python: How to Convert Python String to Int and Back to String

$
0
0

This tutorial describes various ways to convert Python string to int and from an integer to string. You may often need to perform such operations in day to day programming. Hence, you should know them to write better programs. Also, an integer can be represented in different bases, so we’ll explain that too in this post. And there happen to be scenarios where conversion fails. Hence, you should consider such cases as well and can find a full reference given here with examples. By the way, it will be useful if you have some elementary knowledge about the Python data

The post How to Convert Python String to Int and Back to String appeared first on Learn Programming and Software Testing.

Mike Driscoll: Thousands of Scientific Papers May be Invalid Due to Misunderstanding Python

$
0
0

It was recently discovered that several thousand scientific articles could be invalid in their conclusions because scientists did not understand that Python’s glob.glob() does not return sorted results.

This is being reported on by Vice, Slashdot and there’s an interesting discussion going on over on Reddit as well.

Some are reporting this as a glitch in Python, but glob has never guaranteed that is results were returned sorted. As always, I would recommend reading the documentation closely to fully understand what your code does. It would also be a good idea if you can write tests around your code. Python includes a unittest module which makes this easier.

The post Thousands of Scientific Papers May be Invalid Due to Misunderstanding Python appeared first on The Mouse Vs. The Python.

PyCharm: Webinar Preview: “Class Components With Props” tutorial step for React+TS+TDD

$
0
0

As a reminder… this Wednesday (Oct 16) I’m giving a webinar on React+TypeScript+TDD in PyCharm. I’m doing some blog posts about material that will be covered.

webinar2019_watch-the-recording-171

See the first blog post for some background on this webinar and its topic.

Spotlight: Class Components With Props

As we saw in the previous step, child components get props from the parent, and when using TypeScript, you can model that contract with an interface. In his Class Components With Props tutorial step, we switch from a stateless functional component to a class component.

We do this change, of course, by first writing a failing test. Then, as we do the change, we use IDE features to speed us up, both in the test writing as well as the code changes. At no time do we switch to the browser and disrupt our “flow”.

Here’s the full video that accompanies the writeup and code:

Glyph Lefkowitz: Mac Python Distribution Post Updated for Catalina and Notarization

Terry Jones: Daudin – a Python shell

Erik Marsja: How to Read SAS Files in Python with Pandas

$
0
0

The post How to Read SAS Files in Python with Pandas appeared first on Erik Marsja.

In this post, we are going to learn how to read SAS (.sas7dbat) files in Python.

As previously described (in the read .sav files in Python post) Python is a general-purpose language that also can be used for doing data analysis and data visualization.

One potential downside, however, is that Python is not really user-friendly for data storage. This has, of course, lead to that our data many times are stored using Excel, SPSS, SAS, or similar software. See, for instance, the posts about reading .sav and .xlxs files in Python:

Can I Open a SAS File in Python?

Now we may want to answer the question whether how to open a SAS file in Python? In Python, there the two useful packages Pyreadstat, and Pandas that enables us to open SAS files. If we are working with Pandas, the   read_sas method will load a .sav file into a Pandas dataframe. Note, Pyreadstat that is dependent on Pandas, will also create a Pandas dataframe from a .sas file.

How to Open a SAS file in Python

In this secion, we are going to learn how to load a SAS file in Python using the Python package Pyreadstat. Of course, before we use Pyreadstat we need to make sure we have it installed.

How to install Pyreadstat:

Pyreadstat can be installed either using pip or conda:

  1. Install Pyreadstat using pip:
    Open up a terminal, or Windows PowerShell, and type pip install pyreadstat
  2. Install using Conda:
    Open up a terminal, or Windows PowerShell, and type conda install -c conda-forge pyreadstat

How to Load a .sas7bdat File in Python Using Pyreadstat

In this section, we are going to use pyreadstat to import data into a Pandas dataframe. First, we import pyreadstat:

import pyreadstat

Now, we are ready to import SAS files using the method read_sas7bdat (download airline.sas7dbat). Note that, when we load a file using the Pyreadstat package, recognize that it will look for the file in Python’s working directory.

df, meta = pyreadstat.read_sas7bdat('airline.sas7bdat')

In the code chunk above we create two variables; df, and meta. As can be seen when using type the variable “df” is a Pandas dataframe:

type(df)

Thus, we can use all methods available for Pandas dataframe objects. In the next line of code, we are going to print the 5 first rows of the dataframe using pandas head method.

df.head()

See more about working with Pandas dataframes in the following tutorials:

How to Read a SAS file with Python Using Pandas

In this section, we are going to load the same .sav7bdat file into a Pandas dataframe but by using Pandas read_sas method, instead. This have the advantage that we can load the SAS file from an URL.

Before we continue, we need to import Pandas:

import pandas as pd

Now, when we have done that, we can read the .sas7bdat file into a Pandas dataframe using the read_sas method. In the read SAS example here, we are importing the same data file as in the previous example.

Here, we print the 5 last rows of the dataframe using Pandas tail method.

url = 'http://www.principlesofeconometrics.com/sas/airline.sas7bdat'

df = pd.read_sas(url)
df.tail()

How to Read a SAS File and Specific Columns

Note, that read_sas7bdat (Pyreadstat) have the argument “usecols”. By using this argument, we can also select which columns we want to load from the SPSS file to the dataframe:

cols = ['YEAR', 'Y', 'W']
df, meta = pyreadstat.read_sas7bdat('airline.sas7bdat', usecols=cols)
df.head()

How to Save a SAS file to CSV

In this section of the Pandas SAS tutorial we are going to export the .sas7bdat file to a .csv file. This is easy done, we just have to use the to_csv method from the dataframe object we created earlier:

df.to_csv('data_from_sas.csv', index=False)

Remember to put the right path, as second argument, when using to_csv to save a .sas7bdat file as CSV.

Summary: Read SAS Files using Python

Now we have learned how to read and write SAS files in Python. It was quite simple and both methods are, in fact, using the same Python packages.

The post How to Read SAS Files in Python with Pandas appeared first on Erik Marsja.

Mike Driscoll: PyDev of the Week: Elana Hashman

$
0
0

This week we welcome Elana Hashman (@ehashdn) as our PyDev of the Week! Elana is a director of the Open Source Initiative and a fellow of the Python Software Foundation. She is also the Clojure Packaging Team lead and a Java Packaging Team member. You can see some of her work over on Github. You can also learn more about Elana on her website. Let’s take a few moments to get to know her better!

Can you tell us a little about yourself (hobbies, education, etc):

I love to bake and cook, so my Twitter feed tends to be full of various bread pictures or whatever dish I’ve whipped up over the weekend. When I was a kid, I was completely hooked on the cooking channel—my favourite shows were “Iron Chef” and “Good Eats”—and I thought I’d become a chef when I grew up. That’s my back up plan if I ever drop out of tech!

I’m Canadian, and I attended the University of Waterloo in Ontario to study mathematics, majoring in Combinatorics & Optimization with a Computer Science minor. The University of Waterloo is famous for its co-operative study program, where students take an extra year to finish their degrees and forfeit their summers off to complete 5-6 paid co-op work terms. To give my schedule a bit more flexibility, I actually dropped out of the co-op program, but prior to graduating I completed 4 co-op terms, a Google Summer of Code internship, some consulting, and even became an open source maintainer. I learned how to admin servers for the Computer Science Club, and a group of my friends and I revived the Amateur Radio Club after it had been inactive for a decade.

Amateur (or “ham”) radio got me into playing with electronics, so I learned how to solder and now I occasionally build cool things like the PiDP-11 kit. And now that I can solder a PCB, I want to see if I can solder silver, so I’m signing up to take some jewellery-making classes this fall. I also take care of a bunch of wonderful, mostly low-maintenance houseplants. One day I hope to have a full-sized backyard for growing vegetables and setting up radio antennas!

Why did you start using Python?

I first learned Python to contribute to the OpenHatch project back in 2013. I had signed up for the Open Source Day at the Grace Hopper Celebration and was assigned to the WordPress group, but I ran into Asheesh Laroia and Carol Willing earlier at the conference and they poached me! I was amazed at how easy it was to read and understand the project code, even though I hadn’t written any Python before.

My very first bug assignment turned out to be more complex than anticipated, but I was later able to make a contribution and completed an entire summer internship with OpenHatch through Google Summer of Code, where I learned how to write Django and do Python web development. I then maintained the OpenHatch website and backend codebase for a little over a year, before the project started to wind down.

What other programming languages do you know and which is your favorite?

Oh, a lot! My first programming language was probably mIRCscript, which I learned as a teenager to make IRC bots and triggers, but I didn’t pick up any substantial programming skills until university. In school I studied Scheme, C, C++ and bash, and I learned SQL, Perl, and C# during my co-op jobs.

After I graduated, I worked primarily in Clojure, a dialect of Lisp that runs on the JVM. I might call that my favourite programming language because it’s so expressive and powerful, though I’m fond of all Lisps. Most folks would describe Python as a high-level language, but I can write much more terse, elegant abstractions in a Lisp than I can in Python! It’s the only language I’ve written where my colleagues have complimented my code by calling it “pretty” 😀

These days I don’t write much Clojure or Python; for my current day job, I work as a site reliability engineer for OpenShift on Azure, which means I write a lot of Golang and a little bash. I find Go a little bit too low-level for my tastes, but it’s really satisfying and cool to be able to contribute to upstream Kubernetes!

What projects are you working on now?

Outside of work, I spend the majority of my time serving as a director on the board of the Open Source Initiative. I’m a member of the licensing and sponsorship committees, and I chair the membership committee, so it’s my biggest current commitment in open source.

I also lead the Debian Clojure team, though things have been pretty quiet since the Buster release. There’s a few packages I’d like to spiff up and get new uploads completed for in the next few months.

What non-Python open source projects do you enjoy using?

I really enjoy using Mastodon, which is written in Ruby on Rails. It’s a FOSS alternative to Twitter, and it’s decentralized and federated, giving each instance a lot more control over moderation and content. I really like the atmosphere there; it’s friendly, laid back, and not really focused on reputation and branding. Lots of people have multiple accounts to reflect various aspects of themselves: I have a whole account just for food and cooking!

How did you get started with the Python Packaging Authority?

At PyCon sprints in 2016, I wanted to get involved with the Python cryptography project. Paul Kehrer was one of the cryptography development leads and he gave a talk that year on Reliably Distributing Compiled Modules, and suggested that I test out some of the tutorials for building CPython extensions on the manylinux docker images to see if I could make any improvements to the guides.

I knew very little about CPython extensions, so I tried to build the only one I had ever used before: python-kadmin. Pretty quickly, that resulted in me hitting a bug in the auditwheel tool. I didn’t know anything about ABIs or symbol versions, but here were some wild errors telling me that I couldn’t make numerical comparisons with the “MIT” part of the “KERBEROS_5_MIT” symbol versions. After folks at the sprints helped explain to me what was happening under the hood, what the bug was, and how to fix it, I was able to completely rewrite (for the better!) how auditwheel processed symbol version comparisons.

By the next year of PyCon sprints, the original maintainers of auditwheel had moved on. Someone had found a bug in the project and asked me to review and merge their fix. Since I was one of the only active contributors, Donald Stufft granted me maintainer access so I could review pull requests and cut releases. I served as the maintainer of auditwheel for two years after that … and I still haven’t made any contributions to cryptography!

What are Python Packaging Authority’s biggest challenges?

The manylinux project is probably the most technically challenging area of the Python Packaging Authority. It works incredibly well for 90% of use cases, but the 10% that don’t fit into the mold can have a very difficult time producing binaries, and many maintainers that fall into that camp have not hesitated to share their frustration about this. Reliably distributing pre-built binary modules, particularly for the C runtime, is a problem so complex that we have entire operating systems
to solve it!

The Python Packaging Authority has to strike a delicate balance between serving the needs of its users (who want it to be easy to install Python extensions), developers (who support users with source and binary packages), maintainers (who typically don’t work on open source full-time), and companies (who tend to occupy the niche use cases and have specific goals that may not always align with other companies or the rest of the community).

What the the future of Python packaging look like?

Bright and exciting! The manylinux2014 specification was just released, which will bring manylinux support to a number of new machine architectures. Having ceased most of my packaging responsibilities in April, I’ve been really impressed by the folks that have stepped up to maintain auditwheel. There are a lot of excellent people who contribute their time to improving Python packaging, and I’m confident that they will do a great job at navigating the very real challenges the community faces.

Thanks for doing the interview, Elana!

The post PyDev of the Week: Elana Hashman appeared first on The Mouse Vs. The Python.


Codementor: What's New in Odoo 13?

$
0
0
new features in odoo13, odoo13 features, odoo developer

Django Weblog: Django 3.0 beta 1 released

$
0
0

Django 3.0 beta 1 is now available. It represents the second stage in the 3.0 release cycle and is an opportunity for you to try out the changes coming in Django 3.0.

Django 3.0 has a raft of new features which you can read about in the in-development 3.0 release notes.

Only bugs in new features and regressions from earlier versions of Django will be fixed between now and 3.0 final (also, translations will be updated following the "string freeze" when the release candidate is issued). The current release schedule calls for a release candidate in a month from now with the final release to follow about two weeks after that around December 2. Early and often testing from the community will help minimize the number of bugs in the release. Updates on the release schedule schedule are available on the django-developers mailing list.

As with all beta and beta packages, this is not for production use. But if you'd like to take some of the new features for a spin, or to help find and fix bugs (which should be reported to the issue tracker), you can grab a copy of the beta package from our downloads page or on PyPI.

The PGP key ID used for this release is Mariusz Felisiak: 2EF56372BA48CD1B.

Chris Moffitt: Binning Data with Pandas qcut and cut

$
0
0

Introduction

When dealing with continuous numeric data, it is often helpful to bin the data into multiple buckets for further analysis. There are several different terms for binning including bucketing, discrete binning, discretization or quantization. Pandas supports these approaches using the cut and qcut functions. This article will briefly describe why you may want to bin your data and how to use the pandas functions to convert continuous data to a set of discrete buckets. Like many pandas functions, cut and qcut may seem simple but there is a lot of capability packed into those functions. Even for more experience users, I think you will learn a couple of tricks that will be useful for your own analysis.

Binning

One of the most common instances of binning is done behind the scenes for you when creating a histogram. The histogram below of customer sales data, shows how a continuous set of sales numbers can be divided into discrete bins (for example: $60,000 - $70,000) and then used to group and count account instances.

Here is the code that show how we summarize 2018 Sales information for a group of customers. This representation illustrates the number of customers that have sales within certain ranges. Sample code is included in this notebook if you would like to follow along.

importpandasaspdimportnumpyasnpimportseabornassnssns.set_style('whitegrid')raw_df=pd.read_excel('2018_Sales_Total.xlsx')df=raw_df.groupby(['account number','name'])['ext price'].sum().reset_index()df['ext price'].plot(kind='hist')
Image compare

There are many other scenarios where you may want to define your own bins. In the example above, there are 8 bins with data. What if we wanted to divide our customers into 3, 4 or 5 groupings? That’s where pandas qcut and cut come into play. These functions sound similar and perform similar binning functions but have differences that might be confusing to new users. They also have several options that can make them very useful for day to day analysis. The rest of the article will show what their differences are and how to use them.

qcut

The pandas documentation describes qcut as a “Quantile-based discretization function.” This basically means that qcut tries to divide up the underlying data into equal sized bins. The function defines the bins using percentiles based on the distribution of the data, not the actual numeric edges of the bins.

If you have used the pandas describe function, you have already seen an example of the underlying concepts represented by qcut :

df['ext price'].describe()
count20.000000mean101711.287500std27037.449673min55733.05000025%89137.70750050%100271.53500075%110132.552500max184793.700000Name:extprice,dtype:float64

Keep in mind the values for the 25%, 50% and 75% percentiles as we look at using qcut directly.

The simplest use of qcut is to define the number of quantiles and let pandas figure out how to divide up the data. In the example below, we tell pandas to create 4 equal sized groupings of the data.

pd.qcut(df['ext price'],q=4)
0(55733.049000000006,89137.708]1(89137.708,100271.535]2(55733.049000000006,89137.708]....17(110132.552,184793.7]18(100271.535,110132.552]19(100271.535,110132.552]Name:extprice,dtype:categoryCategories(4,interval[float64]):[(55733.049000000006,89137.708]<(89137.708,100271.535]<(100271.535,110132.552]<(110132.552,184793.7]]

The result is a categorical series representing the sales bins. Because we asked for quantiles with q=4 the bins match the percentiles from the describe function.

A common use case is to store the bin results back in the original dataframe for future analysis. For this example, we will create 4 bins (aka quartiles) and 10 bins (aka deciles) and store the results back in the original dataframe:

df['quantile_ex_1']=pd.qcut(df['ext price'],q=4)df['quantile_ex_2']=pd.qcut(df['ext price'],q=10,precision=0)df.head()
account numbernameext pricequantile_ex_1quantile_ex_2
0141962Herman LLC63626.03(55733.049000000006, 89137.708](55732.0, 76471.0]
1146832Kiehn-Spinka99608.77(89137.708, 100271.535](95908.0, 100272.0]
2163416Purdy-Kunde77898.21(55733.049000000006, 89137.708](76471.0, 87168.0]
3218895Kulas Inc137351.96(110132.552, 184793.7](124778.0, 184794.0]
4239344Stokes LLC91535.92(89137.708, 100271.535](90686.0, 95908.0]

You can see how the bins are very different between quantile_ex_1 and quantile_ex_2 . I also introduced the use of precision to define how many decimal points to use for calculating the bin precision.

The other interesting view is to see how the values are distributed across the bins using value_counts :

df['quantile_ex_1'].value_counts()
(110132.552,184793.7]5(100271.535,110132.552]5(89137.708,100271.535]5(55733.049000000006,89137.708]5Name:quantile_ex_1,dtype:int64

Now, for the second column:

df['quantile_ex_2'].value_counts()
(124778.0,184794.0]2(112290.0,124778.0]2(105938.0,112290.0]2(103606.0,105938.0]2(100272.0,103606.0]2(95908.0,100272.0]2(90686.0,95908.0]2(87168.0,90686.0]2(76471.0,87168.0]2(55732.0,76471.0]2Name:quantile_ex_2,dtype:int64

This illustrates a key concept. In each case, there are an equal number of observations in each bin. Pandas does the math behind the scenes to figure out how wide to make each bin. For instance, in quantile_ex_1 the range of the first bin is 74,661.15 while the second bin is only 9,861.02 (110132 - 100271).

One of the challenges with this approach is that the bin labels are not very easy to explain to an end user. For instance, if we wanted to divide our customers into 5 groups (aka quintiles) like an airline frequent flier approach, we can explicitly label the bins to make them easier to interpret.

bin_labels_5=['Bronze','Silver','Gold','Platinum','Diamond']df['quantile_ex_3']=pd.qcut(df['ext price'],q=[0,.2,.4,.6,.8,1],labels=bin_labels_5)df.head()
account numbernameext pricequantile_ex_1quantile_ex_2quantile_ex_3
0141962Herman LLC63626.03(55733.049000000006, 89137.708](55732.0, 76471.0]Bronze
1146832Kiehn-Spinka99608.77(89137.708, 100271.535](95908.0, 100272.0]Gold
2163416Purdy-Kunde77898.21(55733.049000000006, 89137.708](76471.0, 87168.0]Bronze
3218895Kulas Inc137351.96(110132.552, 184793.7](124778.0, 184794.0]Diamond
4239344Stokes LLC91535.92(89137.708, 100271.535](90686.0, 95908.0]Silver

In the example above, I did somethings a little differently. First, I explicitly defined the range of quantiles to use: q=[0, .2, .4, .6, .8, 1] . I also defined the labels labels=bin_labels_5 to use when representing the bins.

Let’s check the distribution:

df['quantile_ex_3'].value_counts()
Diamond4Platinum4Gold4Silver4Bronze4Name:quantile_ex_3,dtype:int64

As expected, we now have an equal distribution of customers across the 5 bins and the results are displayed in an easy to understand manner.

One important item to keep in mind when using qcut is that the quantiles must all be less than 1. Here are some examples of distributions. In most cases it’s simpler to just define q as an integer:

  • terciles: q=[0, 1/3, 2/3, 1] or q=3
  • quintiles: q=[0, .2, .4, .6, .8, 1] or q=5
  • sextiles: q=[0, 1/6, 1/3, .5, 2/3, 5/6, 1] or q=6

One question you might have is, how do I know what ranges are used to identify the different bins? You can use retbins=True to return the bin labels. Here’s a handy snippet of code to build a quick reference table:

results,bin_edges=pd.qcut(df['ext price'],q=[0,.2,.4,.6,.8,1],labels=bin_labels_5,retbins=True)results_table=pd.DataFrame(zip(bin_edges,bin_labels_5),columns=['Threshold','Tier'])
ThresholdTier
055733.050Bronze
187167.958Silver
295908.156Gold
3103606.970Platinum
4112290.054Diamond

Here is another trick that I learned while doing this article. If you try df.describe on categorical values, you get different summary results:

df.describe(include='category')
quantile_ex_1quantile_ex_2quantile_ex_3
count202020
unique4105
top(110132.552, 184793.7](124778.0, 184794.0]Diamond
freq524

I think this is useful and also a good summary of how qcut works.

While we are discussing describe we can using the percentiles argument to define our percentiles using the same format we used for qcut :

df.describe(percentiles=[0,1/3,2/3,1])
account numberext price
count20.00000020.000000
mean476998.750000101711.287500
std231499.20897027037.449673
min141962.00000055733.050000
0%141962.00000055733.050000
33.3%332759.33333391241.493333
50%476006.500000100271.535000
66.7%662511.000000104178.580000
100%786968.000000184793.700000
max786968.000000184793.700000

There is one minor note about this functionality. Passing 0 or 1, just means that the 0% will be the same as the min and 100% will be same as the max. I also learned that the 50th percentile will always be included, regardless of the values passed.

Before we move on to describing cut , there is one more potential way that we can label our bins. Instead of the bin ranges or custom labels, we can return integers by passing labels=False

df['quantile_ex_4']=pd.qcut(df['ext price'],q=[0,.2,.4,.6,.8,1],labels=False,precision=0)df.head()
account numbernameext pricequantile_ex_1quantile_ex_2quantile_ex_3quantile_ex_4
0141962Herman LLC63626.03(55733.049000000006, 89137.708](55732.0, 76471.0]Bronze0
1146832Kiehn-Spinka99608.77(89137.708, 100271.535](95908.0, 100272.0]Gold2
2163416Purdy-Kunde77898.21(55733.049000000006, 89137.708](76471.0, 87168.0]Bronze0
3218895Kulas Inc137351.96(110132.552, 184793.7](124778.0, 184794.0]Diamond4
4239344Stokes LLC91535.92(89137.708, 100271.535](90686.0, 95908.0]Silver1

Personally, I think using bin_labels is the most useful scenario but there could be cases where the integer response might be helpful so I wanted to explicitly point it out.

cut

Now that we have discussed how to use qcut , we can show how cut is different. Many of the concepts we discussed above apply but there are a couple of differences with the usage of cut .

The major distinction is that qcut will calculate the size of each bin in order to make sure the distribution of data in the bins is equal. In other words, all bins will have (roughly) the same number of observations but the bin range will vary.

On the other hand, cut is used to specifically define the bin edges. There is no guarantee about the distribution of items in each bin. In fact, you can define bins in such a way that no items are included in a bin or nearly all items are in a single bin.

In real world examples, bins may be defined by business rules. For a frequent flier program, 25,000 miles is the silver level and that does not vary based on year to year variation of the data. If we want to define the bin edges (25,000 - 50,000, etc) we would use cut . We can also use cut to define bins that are of constant size and let pandas figure out how to define those bin edges.

Some examples should make this distinction clear.

For the sake of simplicity, I am removing the previous columns to keep the examples short:

df=df.drop(columns=['quantile_ex_1','quantile_ex_2','quantile_ex_3','quantile_ex_4'])

For the first example, we can cut the data into 4 equal bin sizes. Pandas will perform the math behind the scenes to determine how to divide the data set into these 4 groups:

pd.cut(df['ext price'],bins=4)
0(55603.989,87998.212]1(87998.212,120263.375]2(55603.989,87998.212]3(120263.375,152528.538]4(87998.212,120263.375]....14(87998.212,120263.375]15(120263.375,152528.538]16(87998.212,120263.375]17(87998.212,120263.375]18(87998.212,120263.375]19(87998.212,120263.375]Name:extprice,dtype:categoryCategories(4,interval[float64]):[(55603.989,87998.212]<(87998.212,120263.375]<(120263.375,152528.538]<(152528.538,184793.7]]

Let’s look at the distribution:

pd.cut(df['ext price'],bins=4).value_counts()
(87998.212,120263.375]12(55603.989,87998.212]5(120263.375,152528.538]2(152528.538,184793.7]1Name:extprice,dtype:int64

The first thing you’ll notice is that the bin ranges are all about 32,265 but that the distribution of bin elements is not equal. The bins have a distribution of 12, 5, 2 and 1 item(s) in each bin. In a nutshell, that is the essential difference between cut and qcut .

Info
If you want equal distribution of the items in your bins, use qcut . If you want to define your own numeric bin ranges, then use cut .

Before going any further, I wanted to give a quick refresher on interval notation. In the examples above, there have been liberal use of ()’s and []’s to denote how the bin edges are defined. For those of you (like me) that might need a refresher on interval notation, I found this simple site very easy to understand.

To bring this home to our example, here is a diagram based off the example above:

Interval notation

When using cut, you may be defining the exact edges of your bins so it is important to understand if the edges include the values or not. Depending on the data set and specific use case, this may or may not be a big issue. It can certainly be a subtle issue you do need to consider.

To bring it into perspective, when you present the results of your analysis to others, you will need to be clear whether an account with 70,000 in sales is a silver or gold customer.

Here is an example where we want to specifically define the boundaries of our 4 bins by defining the bins parameter.

cut_labels_4=['silver','gold','platinum','diamond']cut_bins=[0,70000,100000,130000,200000]df['cut_ex1']=pd.cut(df['ext price'],bins=cut_bins,labels=cut_labels_4)
account numbernameext pricecut_ex1
0141962Herman LLC63626.03silver
1146832Kiehn-Spinka99608.77gold
2163416Purdy-Kunde77898.21gold
3218895Kulas Inc137351.96diamond
4239344Stokes LLC91535.92gold

One of the challenges with defining the bin ranges with cut is that it can be cumbersome to create the list of all the bin ranges. There are a couple of shortcuts we can use to compactly create the ranges we need.

First, we can use numpy.linspace to create an equally spaced range:

pd.cut(df['ext price'],bins=np.linspace(0,200000,9))
0(50000.0,75000.0]1(75000.0,100000.0]2(75000.0,100000.0]....18(100000.0,125000.0]19(100000.0,125000.0]Name:extprice,dtype:categoryCategories(8,interval[float64]):[(0.0,25000.0]<(25000.0,50000.0]<(50000.0,75000.0]<(75000.0,100000.0]<(100000.0,125000.0]<(125000.0,150000.0]<(150000.0,175000.0]<(175000.0,200000.0]]

Numpy’s linspace is a simple function that provides an array of evenly spaced numbers over a user defined range. In this example, we want 9 evenly spaced cut points between 0 and 200,000. Astute readers may notice that we have 9 numbers but only 8 categories. If you map out the actual categories, it should make sense why we ended up with 8 categories between 0 and 200,000. In all instances, there is one less category than the number of cut points.

The other option is to use numpy.arange which offers similar functionality. I found this article a helpful guide in understanding both functions. I recommend trying both approaches and seeing which one works best for your needs.

There is one additional option for defining your bins and that is using pandas interval_range . I had to look at the pandas documentation to figure out this one. It is a bit esoteric but I think it is good to include it.

The interval_range offers a lot of flexibility. For instance, it can be used on date ranges as well numerical values. Here is a numeric example:

pd.interval_range(start=0,freq=10000,end=200000,closed='left')
IntervalIndex([[0,10000),[10000,20000),[20000,30000),[30000,40000),[40000,50000)...[150000,160000),[160000,170000),[170000,180000),[180000,190000),[190000,200000)],closed='left',dtype='interval[int64]')

There is a downside to using interval_range . You can not define custom labels.

interval_range=pd.interval_range(start=0,freq=10000,end=200000)df['cut_ex2']=pd.cut(df['ext price'],bins=interval_range,labels=[1,2,3])df.head()
account numbernameext pricecut_ex1cut_ex2
0141962Herman LLC63626.03gold(60000, 70000]
1146832Kiehn-Spinka99608.77silver(90000, 100000]
2163416Purdy-Kunde77898.21silver(70000, 80000]
3218895Kulas Inc137351.96diamond(130000, 140000]
4239344Stokes LLC91535.92silver(90000, 100000]

As shown above, the labels parameter is ignored when using the interval_range .

In my experience, I use a custom list of bin ranges or linspace if I have a large number of bins.

One of the differences between cut and qcut is that you can also use the include_lowest paramete to define whether or not the first bin should include all of the lowest values. Finally, passing right=False will alter the bins to exclude the right most item. Because cut allows much more specificity of the bins, these parameters can be useful to make sure the intervals are defined in the manner you expect.

The rest of the cut functionality is similar to qcut . We can return the bins using retbins=True or adjust the precision using the precision argument.

Summary

The concept of breaking continuous values into discrete bins is relatively straightforward to understand and is a useful concept in real world analysis. Fortunately, pandas provides the cut and qcut functions to make this as simple or complex as you need it to be. I hope this article proves useful in understanding these pandas functions. Please feel free to comment below if you have any questions.

credits

Photo by Radek Grzybowski on Unsplash

Kushal Das: Unoon, a tool to monitor network connections from my system

$
0
0

I always wanted to have a tool to monitor the network connections from my laptop/desktop. I wanted to have alerts for random processes making network connections, and a way to block those (if I want to).

Such a tool can provide peace of mind in a few cases. A reverse shell is one the big one, just in case if I manage to open any random malware (read downloads) on my regular Linux system, I want to be notified about the connections it will make. The same goes for trying out any new application. I prefer to use Qubes OS based VMs testing random binaries and applications, and it is also my daily driver. But, the search for a proper tool continued for some time.

Introducing unoon

Unoon main screen

Unoon is a desktop tool that I started writing for monitoring network connections for my system. It has two parts, the backend is written in Go and that monitor and adds details to a local Redis instance (this should be password protected).

I started writing this backend in Rust, but then I had to rewrite it in Go as I wanted to reuse parts of my code from another project so that I can track all DNS queries from the system. This helps to make sense of the data; otherwise, we will see some random IP numbers in the UI.

The frontend is written using PyQt5. Around 14 years ago, I released my first ever released tool using PyQt, and it is still my favorite library to create a desktop application.

Using the development version of unoon

The README has the build steps. You have to start the backend as a daemon, the easiest option is to run it inside of a tmux shell. At first, it will show all the currently running processes in the first “Current processes” tab. If you add any executable (via the absolute path) in the Edit->whitelists dialog and then save (and then restart the UI app), those will turn up the whitelisted processes.

Unoon alert

For any new process making network calls, you will get an alert dialog. In the future, we will have the option to block hosts/ips via this alert dialog.

Unoon history

The history tabs will show all alerts history in the runtime. Again, we will have to save this information in a local database, so that we can have better statistics shown to the users.

You can move between different tabs/tables via Alt+1 or Alt+2 and Alt+3 key combinations.

I will add more options to create better-whitelisted processes. There is also ongoing work to mark any normal process as a whitelisted one from the UI (by right-clicking).

Last week, Micah and I managed to spend some late-night hotel room hacking on this tool.

How can you help?

You can start by testing the code base, and provide suggestions on how to improve the tool. Help in UX (major concern) and patches are always welcome.

A small funny story

A few weeks back, on a Sunday late night, I was demoing the very initial version of the tool to Saptak. While we were talking about the tool, suddenly, an entry popped up in the UI /usr/bin/ssh, to a random host. A little bit of search showed that the IP belongs to an EC2 instance. For the next 40 minutes, we both were trying to debug to find out what happened and if the system was already compromised or not. Luckily I was talking about something else before, and to demo something (we totally forgot that topic), I was running Wireshark on the system. From there, we figured that the IP belongs to github.com. It took some more time to figure out that one of my VS Code extension was updating the git, and was using ssh. This is when I understood that I need to show the real domain names on the UI than random IP addresses.

Real Python: Cool New Features in Python 3.8

$
0
0

The newest version of Python is released today! Python 3.8 has been available in beta versions since the summer, but on October 14th, 2019 the first official version is ready. Now, we can all start playing with the new features and benefit from the latest improvements.

What does Python 3.8 bring to the table? The documentation gives a good overview of the new features. However, this article will go more in depth on some of the biggest changes, and show you how you can take advantage of Python 3.8.

In this article, you’ll learn about:

  • Using assignment expressions to simplify some code constructs
  • Enforcing positional-only arguments in your own functions
  • Specifying more precise type hints
  • Using f-strings for simpler debugging

With a few exceptions, Python 3.8 contains many small improvements over the earlier versions. Towards the end of the article, you’ll see many of these less attention-grabbing changes, as well as a discussion about some of the optimizations that make Python 3.8 faster than its predecessors. Finally, you’ll get some advice about upgrading to the new version.

Free Bonus:Click here to get access to a chapter from Python Tricks: The Book that shows you Python's best practices with simple examples you can apply instantly to write more beautiful + Pythonic code.

The Walrus in the Room: Assignment Expressions

The biggest change in Python 3.8 is the introduction of assignment expressions. They are written using a new notation (:=). This operator is often called the walrus operator as it resembles the eyes and tusks of a walrus on its side.

Assignment expressions allow you to assign and return a value in the same expression. For example, if you want to assign to a variable and print its value, then you typically do something like this:

>>>
>>> walrus=False>>> print(walrus)False

In Python 3.8, you’re allowed to combine these two statements into one, using the walrus operator:

>>>
>>> print(walrus:=True)True

The assignment expression allows you to assign True to walrus, and immediately print the value. But keep in mind that the walrus operator does not do anything that isn’t possible without it. It only makes certain constructs more convenient, and can sometimes communicate the intent of your code more clearly.

One pattern that shows some of the strengths of the walrus operator is while loops where you need to initialize and update a variable. For example, the following code asks the user for input until they type quit:

inputs=list()current=input("Write something: ")whilecurrent!="quit":inputs.append(current)current=input("Write something: ")

This code is less than ideal. You’re repeating the input() statement, and somehow you need to add current to the list before asking the user for it. A better solution is to set up an infinite while loop, and use break to stop the loop:

inputs=list()whileTrue:current=input("Write something: ")ifcurrent=="quit":breakinputs.append(current)

This code is equivalent to the one above, but avoids the repetition and somehow keeps the lines in a more logical order. If you use an assignment expression, you can simplify this loop further:

inputs=list()while(current:=input("Write something: "))!="quit":inputs.append(current)

This moves the test back to the while line, where it should be. However, there are now several things happening at that line, so it takes a bit more effort to read it properly. Use your best judgement about when the walrus operator helps make your code more readable.

PEP 572 describes all the details of assignment expressions, including some of the rationale for introducing them into the language, as well as several examples of how the walrus operator can be used.

Positional-Only Arguments

The built-in function float() can be used for converting text strings and numbers to float objects. Consider the following example:

>>>
>>> float("3.8")3.8>>> help(float)class float(object) |  float(x=0, /) |   |  Convert a string or number to a floating point number, if possible.[...]

Look closely at the signature of float(). Notice the slash (/) after the parameter. What does it mean?

Note: For an in-depth discussion on the / notation, see PEP 457 - Notation for Positional-Only Parameters.

It turns out that while the one parameter of float() is called x, you’re not allowed to use its name:

>>>
>>> float(x="3.8")Traceback (most recent call last):
  File "<stdin>", line 1, in <module>TypeError: float() takes no keyword arguments

When using float() you’re only allowed to specify arguments by position, not by keyword. Before Python 3.8, such positional-only arguments were only possible for built-in functions. There was no easy way to specify that arguments should be positional-only in your own functions:

>>>
>>> defincr(x):... returnx+1... >>> incr(3.8)4.8>>> incr(x=3.8)4.8

It’s possible to simulate positional-only arguments using *args, but this is less flexible, less readable, and forces you to implement your own argument parsing. In Python 3.8, you can use / to denote that all arguments before it must be specified by position. You can rewrite incr() to only accept positional arguments:

>>>
>>> defincr(x,/):... returnx+1... >>> incr(3.8)4.8>>> incr(x=3.8)Traceback (most recent call last):
  File "<stdin>", line 1, in <module>TypeError: incr() got some positional-only arguments passed as           keyword arguments: 'x'

By adding / after x, you specify that x is a positional-only argument. You can combine regular arguments with positional-only ones by placing the regular arguments after the slash:

>>>
>>> defgreet(name,/,greeting="Hello"):... returnf"{greeting}, {name}"... >>> greet("Łukasz")'Hello, Łukasz'>>> greet("Łukasz",greeting="Awesome job")'Awesome job, Łukasz'>>> greet(name="Łukasz",greeting="Awesome job")Traceback (most recent call last):
  File "<stdin>", line 1, in <module>TypeError: greet() got some positional-only arguments passed as           keyword arguments: 'name'

In greet(), the slash is placed between name and greeting. This means that name is a positional-only argument, while greeting is a regular argument that can be passed either by position or by keyword.

At first glance, positional-only arguments can seem a bit limiting and contrary to Python’s mantra about the importance of readability. You will probably find that there are not a lot of occasions where positional-only arguments improve your code.

However, in the right circumstances, positional-only arguments can give you some flexibility when you’re designing functions. First, positional-only arguments make sense when you have arguments that have a natural order but are hard to give good, descriptive names to.

Another possible benefit of using positional-only arguments is that you can more easily refactor your functions. In particular, you can change the name of your parameters without worrying that other code depends on those names.

Positional-only arguments nicely complement keyword-only arguments. In any version of Python 3, you can specify keyword-only arguments using the star (*). Any argument after* must be specified using a keyword:

>>>
>>> defto_fahrenheit(*,celsius):... return32+celsius*9/5... >>> to_fahrenheit(40)Traceback (most recent call last):
  File "<stdin>", line 1, in <module>TypeError: to_fahrenheit() takes 0 positional arguments but 1 was given>>> to_fahrenheit(celsius=40)104.0

celsius is a keyword-only argument, so Python raises an error if you try to specify it based on position, without the keyword.

You can combine positional-only, regular, and keyword-only arguments, by specifying them in this order separated by / and *. In the following example, text is a positional-only argument, border is a regular argument with a default value, and width is a keyword-only argument with a default value:

>>>
>>> defheadline(text,/,border="♦",*,width=50):... returnf" {text}".center(width,border)... 

Since text is positional-only, you can’t use the keyword text:

>>>
>>> headline("Positional-only Arguments")'♦♦♦♦♦♦♦♦♦♦♦ Positional-only Arguments ♦♦♦♦♦♦♦♦♦♦♦♦'>>> headline(text="This doesn't work!")Traceback (most recent call last):
  File "<stdin>", line 1, in <module>TypeError: headline() got some positional-only arguments passed as           keyword arguments: 'text'

border, on the other hand, can be specified both with and without the keyword:

>>>
>>> headline("Python 3.8","=")'=================== Python 3.8 ==================='>>> headline("Real Python",border=":")':::::::::::::::::: Real Python :::::::::::::::::::'

Finally, width must be specified using the keyword:

>>>
>>> headline("Python","🐍",width=38)'🐍🐍🐍🐍🐍🐍🐍🐍🐍🐍🐍🐍🐍🐍🐍 Python 🐍🐍🐍🐍🐍🐍🐍🐍🐍🐍🐍🐍🐍🐍🐍'>>> headline("Python","🐍",38)Traceback (most recent call last):
  File "<stdin>", line 1, in <module>TypeError: headline() takes from 1 to 2 positional arguments           but 3 were given

You can read more about positional-only arguments in PEP 570.

More Precise Types

Python’s typing system is quite mature at this point. However, in Python 3.8, some new features have been added to typing to allow more precise typing:

  • Literal types
  • Typed dictionaries
  • Final objects
  • Protocols

Python supports optional type hints, typically as annotations on your code:

defdouble(number:float)->float:return2*number

In this example, you say that number should be a float and the double() function should return a float, as well. However, Python treats these annotations as hints. They are not enforced at runtime:

>>>
>>> double(3.14)6.28>>> double("I'm not a float")"I'm not a floatI'm not a float"

double() happily accepts "I'm not a float" as an argument, even though that’s not a float. There are libraries that can use types at runtime, but that is not the main use case for Python’s type system.

Instead, type hints allow static type checkers to do type checking of your Python code, without actually running your scripts. This is reminiscent of compilers catching type errors in other languages like Java, Rust, and Crystal. Additionally, type hints act as documentation of your code, making it easier to read, as well as improving auto-complete in your IDE.

Note: There are several static type checkers available, including Pyright, Pytype, and Pyre. In this article, you’ll use Mypy. You can install Mypy from PyPI using pip:

$ python -m pip install mypy

In some sense, Mypy is the reference implementation of a type checker for Python, and is being developed at Dropbox under the lead of Jukka Lehtasalo. Python’s creator, Guido van Rossum, is part of the Mypy team.

You can find more information about type hints in Python in the original PEP 484, as well as in Python Type Checking (Guide).

There are four new PEPs about type checking that have been accepted and included in Python 3.8. You’ll see short examples from each of these.

PEP 586 introduce the Literal type. Literal is a bit special in that it represents one or several specific values. One use case of Literal is to be able to precisely add types, when string arguments are used to describe specific behavior. Consider the following example:

# draw_line.pydefdraw_line(direction:str)->None:ifdirection=="horizontal":...# Draw horizontal lineelifdirection=="vertical":...# Draw vertical lineelse:raiseValueError(f"invalid direction {direction!r}")draw_line("up")

The program will pass the static type checker, even though "up" is an invalid direction. The type checker only checks that "up" is a string. In this case, it would be more precise to say that direction must be either the literal string "horizontal" or the literal string "vertical". Using Literal, you can do exactly that:

# draw_line.pyfromtypingimportLiteraldefdraw_line(direction:Literal["horizontal","vertical"])->None:ifdirection=="horizontal":...# Draw horizontal lineelifdirection=="vertical":...# Draw vertical lineelse:raiseValueError(f"invalid direction {direction!r}")draw_line("up")

By exposing the allowed values of direction to the type checker, you can now be warned about the error:

$ mypy draw_line.py 
draw_line.py:15: error:    Argument 1 to "draw_line" has incompatible type "Literal['up']";    expected "Union[Literal['horizontal'], Literal['vertical']]"Found 1 error in 1 file (checked 1 source file)

The basic syntax is Literal[<literal>]. For instance, Literal[38] represents the literal value 38. You can express one of several literal values using Union:

Union[Literal["horizontal"],Literal["vertical"]]

Since this is a fairly common use case, you can (and probably should) use the simpler notation Literal["horizontal", "vertical"] instead. You already used the latter when adding types to draw_line(). If you look carefully at the output from Mypy above, you can see that it translated the simpler notation to the Union notation internally.

There are cases where the type of the return value of a function depends on the input arguments. One example is open() which may return a text string or a byte array depending on the value of mode. This can be handled through overloading.

The following example shows the skeleton of a calculator that can return the answer either as regular numbers (38), or as roman numerals (XXXVIII):

# calculator.pyfromtypingimportUnionARABIC_TO_ROMAN=[(1000,"M"),(900,"CM"),(500,"D"),(400,"CD"),(100,"C"),(90,"XC"),(50,"L"),(40,"XL"),(10,"X"),(9,"IX"),(5,"V"),(4,"IV"),(1,"I")]def_convert_to_roman_numeral(number:int)->str:"""Convert number to a roman numeral string"""result=list()forarabic,romaninARABIC_TO_ROMAN:count,number=divmod(number,arabic)result.append(roman*count)return"".join(result)defadd(num_1:int,num_2:int,to_roman:bool=True)->Union[str,int]:"""Add two numbers"""result=num_1+num_2ifto_roman:return_convert_to_roman_numeral(result)else:returnresult

The code has the correct type hints: the result of add() will be either str or int. However, often this code will be called with a literal True or False as the value of to_roman in which case you would like the type checker to infer exactly whether str or int is returned. This can be done using Literal together with @overload:

# calculator.pyfromtypingimportLiteral,overload,UnionARABIC_TO_ROMAN=[(1000,"M"),(900,"CM"),(500,"D"),(400,"CD"),(100,"C"),(90,"XC"),(50,"L"),(40,"XL"),(10,"X"),(9,"IX"),(5,"V"),(4,"IV"),(1,"I")]def_convert_to_roman_numeral(number:int)->str:"""Convert number to a roman numeral string"""result=list()forarabic,romaninARABIC_TO_ROMAN:count,number=divmod(number,arabic)result.append(roman*count)return"".join(result)@overloaddefadd(num_1:int,num_2:int,to_roman:Literal[True])->str:...@overloaddefadd(num_1:int,num_2:int,to_roman:Literal[False])->int:...defadd(num_1:int,num_2:int,to_roman:bool=True)->Union[str,int]:"""Add two numbers"""result=num_1+num_2ifto_roman:return_convert_to_roman_numeral(result)else:returnresult

The added @overload signatures will help your type checker infer str or int depending on the literal values of to_roman. Note that the ellipses (...) are a literal part of the code. They stand in for the function body in the overloaded signatures.

As a complement to Literal, PEP 591 introduces Final. This qualifier specifies that a variable or attribute should not be reassigned, redefined, or overridden. The following is a typing error:

fromtypingimportFinalID:Final=1...ID+=1

Mypy will highlight the line ID += 1, and note that you Cannot assign to final name "ID". This gives you a way to ensure that constants in your code never change their value.

Additionally, there is also a @final decorator that can be applied to classes and methods. Classes decorated with @final can’t be subclassed, while @final methods can’t be overridden by subclasses:

fromtypingimportfinal@finalclassBase:...classSub(Base):...

Mypy will flag this example with the error message Cannot inherit from final class "Base". To learn more about Final and @final, see PEP 591.

The third PEP allowing for more specific type hints is PEP 589, which introduces TypedDict. This can be used to specify types for keys and values in a dictionary using a notation that is similar to the typed NamedTuple.

Traditionally, dictionaries have been annotated using Dict. The issue is that this only allowed one type for the keys and one type for the values, often leading to annotations like Dict[str, Any]. As an example, consider a dictionary that registers information about Python versions:

py38={"version":"3.8","release_year":2019}

The value corresponding to version is a string, while release_year is an integer. This can’t be precisely represented using Dict. With the new TypedDict, you can do the following:

fromtypingimportTypedDictclassPythonVersion(TypedDict):version:strrelease_year:intpy38=PythonVersion(version="3.8",release_year=2019)

The type checker will then be able to infer that py38["version"] has type str, while py38["release_year"] is an int. At runtime, a TypedDict is a regular dict, and type hints are ignored as usual. You can also use TypedDict purely as an annotation:

py38:PythonVersion={"version":"3.8","release_year":2019}

Mypy will let you know if any of your values has the wrong type, or if you use a key that has not been declared. See PEP 589 for more examples.

Mypy has supported Protocols for a while already. However, the official acceptance only happened in May 2019.

Protocols are a way of formalizing Python’s support for duck typing:

When I see a bird that walks like a duck and swims like a duck and quacks like a duck, I call that bird a duck. (Source)

Duck typing allows you to, for example, read .name on any object that has a .name attribute, without really caring about the type of the object. It may seem counter-intuitive for the typing system to support this. Through structural subtyping, it’s still possible to make sense of duck typing.

You can for instance define a protocol called Named that can identify all objects with a .name attribute:

fromtypingimportProtocolclassNamed(Protocol):name:strdefgreet(obj:Named)->None:print(f"Hi {obj.name}")

Here, greet() takes any object, as long as it defines a .name attribute. See PEP 544 and the Mypy documentation for more information about protocols.

Simpler Debugging With f-Strings

f-strings were introduced in Python 3.6, and have become very popular. They might be the most common reason for Python libraries only being supported on version 3.6 and later. An f-string is a formatted string literal. You can recognize it by the leading f:

>>>
>>> style="formatted">>> f"This is a {style} string"'This is a formatted string'

When you use f-strings, you can enclose variables and even expressions inside curly braces. They will then be evaluated at runtime and included in the string. You can have several expressions in one f-string:

>>>
>>> importmath>>> r=3.6>>> f"A circle with radius {r} has area {math.pi * r * r:.2f}"'A circle with radius 3.6 has area 40.72'

In the last expression, {math.pi * r * r:.2f}, you also use a format specifier. Format specifiers are separated from the expressions with a colon.

.2f means that the area is formatted as a floating point number with 2 decimals. The format specifiers are the same as for .format(). See the official documentation for a full list of allowed format specifiers.

In Python 3.8, you can use assignment expressions inside f-strings. Just make sure to surround the assignment expression with parentheses:

>>>
>>> importmath>>> r=3.8>>> f"Diameter {(diam := 2 * r)} gives circumference {math.pi * diam:.2f}"'Diameter 7.6 gives circumference 23.88'

However, the real f-news in Python 3.8 is the new debugging specifier. You can now add = at the end of an expression, and it will print both the expression and its value:

>>>
>>> python=3.8>>> f"{python=}"'python=3.8'

This is a short-hand, that typically will be most useful when working interactively or adding print statements to debug your script. In earlier versions of Python, you needed to spell out the variable or expression twice to get the same information:

>>>
>>> python=3.7>>> f"python={python}"'python=3.7'

You can add spaces around =, and use format specifiers as usual:

>>>
>>> name="Eric">>> f"{name = }""name = 'Eric'">>> f"{name = :>10}"'name =       Eric'

The >10 format specifier says that name should be right-aligned within a 10 character string. = works for more complex expressions as well:

>>>
>>> f"{name.upper()[::-1] = }""name.upper()[::-1] = 'CIRE'"

For more information about f-strings, see Python 3’s f-Strings: An Improved String Formatting Syntax (Guide).

The Python Steering Council

Technically, Python’s governance is not a language feature. However, Python 3.8 is the first version of Python not developed under the benevolent dictatorship of Guido van Rossum. The Python language is now governed by a steering council consisting of five core developers:

The road to the new governance model for Python was an interesting study in self-organization. Guido van Rossum created Python in the early 1990s, and has been affectionally dubbed Python’s Benevolent Dictator for Life (BDFL). Through the years, more and more decisions about the Python language were made through Python Enhancement Proposals (PEPs). Still, Guido officially had the last word on any new language feature.

After a long and drawn out discussion about assignment expressions, Guido announced in July 2018 that he was retiring from his role as BDFL (for real this time). He purposefully did not name a successor. Instead, he asked the team of core developers to figure out how Python should be governed going forward.

Luckily, the PEP process was already well established, so it was natural to use PEPs to discuss and decide on a new governance model. Through the fall of 2018, several models were proposed, including electing a new BDFL (renamed the Gracious Umpire Influencing Decisions Officer: the GUIDO), or moving to a community model based on consensus and voting, without centralized leadership. In December 2018, the steering council model was chosen after a vote among the core developers.

The Python Steering Council at PyCon 2019The Python Steering Council at PyCon 2019. From left to right: Barry Warsaw, Brett Cannon, Carol Willing, Guido van Rossum, and Nick Loghlan (Image: Geir Arne Hjelle)

The steering council consists of five members of the Python community, as listed above. There will be an election for a new steering council after every major release of Python. In other words, there will be an election following the release of Python 3.8.

Although it’s an open election, it’s expected that most, if not all, of the inaugural steering council will be reelected. The steering council has broad powers to make decisions about the Python language, but should strive to exercise those powers as little as possible.

You can read all about the new governance model in PEP 13, while the process of deciding on the new model is described in PEP 8000. For more information, see the PyCon 2019 Keynote, and listen to Brett Cannon on Talk Python To Me and on The Changelog podcast. You can follow updates from the steering council on GitHub.

Other Pretty Cool Features

So far, you’ve seen the headline news regarding what’s new in Python 3.8. However, there are many other changes that are also pretty cool. In this section, you’ll get a quick look at some of them.

importlib.metadata

There is one new module available in the standard library in Python 3.8: importlib.metadata. Through this module, you can access information about installed packages in your Python installation. Together with its companion module, importlib.resources, importlib.metadata improves on the functionality of the older pkg_resources.

As an example, you can get some information about pip:

>>>
>>> fromimportlibimportmetadata>>> metadata.version("pip")'19.2.3'>>> pip_metadata=metadata.metadata("pip")>>> list(pip_metadata)['Metadata-Version', 'Name', 'Version', 'Summary', 'Home-page', 'Author', 'Author-email', 'License', 'Keywords', 'Platform', 'Classifier',  'Classifier', 'Classifier', 'Classifier', 'Classifier', 'Classifier',  'Classifier', 'Classifier', 'Classifier', 'Classifier', 'Classifier',  'Classifier', 'Classifier', 'Requires-Python']>>> pip_metadata["Home-page"]'https://pip.pypa.io/'>>> pip_metadata["Requires-Python"]'>=2.7,!=3.0.*,!=3.1.*,!=3.2.*,!=3.3.*,!=3.4.*'>>> len(metadata.files("pip"))668

The currently installed version of pip is 19.2.3. metadata() gives access to most of the information that you can see on PyPI. You can for instance see that this version of pip requires either Python 2.7, or Python 3.5 or higher. With files(), you get a listing of all files that make up the pip package. In this case, there are almost 700 files.

files() returns a list of Path objects. These give you a convenient way of looking into the source code of a package, using read_text(). The following example prints out __init__.py from the realpython-reader package:

>>>
>>> [pforpinmetadata.files("realpython-reader")ifp.suffix==".py"][PackagePath('reader/__init__.py'), PackagePath('reader/__main__.py'), PackagePath('reader/feed.py'), PackagePath('reader/viewer.py')]>>> init_path=_[0]# Underscore access last returned value in the REPL>>> print(init_path.read_text())"""Real Python feed readerImport the `feed` module to work with the Real Python feed:>>> from reader import feed>>> feed.get_titles()    ['Logging in Python', 'The Best Python Books', ...]See https://github.com/realpython/reader/ for more information"""# Version of realpython-reader package__version__ = "1.0.0"...

You can also access package dependencies:

>>>
>>> metadata.requires("realpython-reader")['feedparser', 'html2text', 'importlib-resources', 'typing']

requires() lists the dependencies of a package. You can see that realpython-reader for instance uses feedparser in the background to read and parse a feed of articles.

There is a backport of importlib.metadataavailable on PyPI that works on earlier versions of Python. You can install it using pip:

$ python -m pip install importlib-metadata

You can fall back on using the PyPI backport in your code as follows:

try:fromimportlibimportmetadataexceptImportError:importimportlib_metadataasmetadata...

See the documentation for more information about importlib.metadata

New and Improved math and statistics Functions

Python 3.8 brings many improvements to existing standard library packages and modules. math in the standard library has a few new functions. math.prod() works similarly to the built-in sum(), but for multiplicative products:

>>>
>>> importmath>>> math.prod((2,8,7,7))784>>> 2*8*7*7784

The two statements are equivalent. prod() will be easier to use when you already have the factors stored in an iterable.

Another new function is math.isqrt(). You can use isqrt() to find the integer part of square roots:

>>>
>>> importmath>>> math.isqrt(9)3>>> math.sqrt(9)3.0>>> math.isqrt(15)3>>> math.sqrt(15)3.872983346207417

The square root of 9 is 3. You can see that isqrt() returns an integer result, while math.sqrt() always returns a float. The square root of 15 is almost 3.9. Note that isqrt()truncates the answer down to the next integer, in this case 3.

Finally, you can now more easily work with n-dimensional points and vectors in the standard library. You can find the distance between two points with math.dist(), and the length of a vector with math.hypot():

>>>
>>> importmath>>> point_1=(16,25,20)>>> point_2=(8,15,14)>>> math.dist(point_1,point_2)14.142135623730951>>> math.hypot(*point_1)35.79106033634656>>> math.hypot(*point_2)22.02271554554524

This makes it easier to work with points and vectors using the standard library. However, if you will be doing many calculations on points or vectors, you should check out NumPy.

The statistics module also has several new functions:

The following example shows the functions in use:

>>>
>>> importstatistics>>> data=[9,3,2,1,1,2,7,9]>>> statistics.fmean(data)4.25>>> statistics.geometric_mean(data)3.013668912157617>>> statistics.multimode(data)[9, 2, 1]>>> statistics.quantiles(data,n=4)[1.25, 2.5, 8.5]

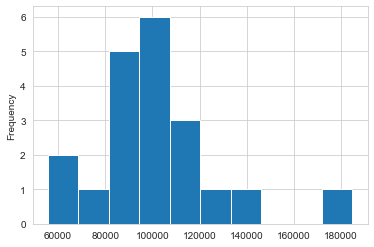
In Python 3.8, there is a new statistics.NormalDist class that makes it more convenient to work with the Gaussian normal distribution.

To see an example of using NormalDist, you can try to compare the speed of the new statistics.fmean() and the traditional statistics.mean():

>>>
>>> importrandom>>> importstatistics>>> fromtimeitimporttimeit>>> # Create 10,000 random numbers>>> data=[random.random()for_inrange(10_000)]>>> # Measure the time it takes to run mean() and fmean()>>> t_mean=[timeit("statistics.mean(data)",number=100,globals=globals())... for_inrange(30)]>>> t_fmean=[timeit("statistics.fmean(data)",number=100,globals=globals())... for_inrange(30)]>>> # Create NormalDist objects based on the sampled timings>>> n_mean=statistics.NormalDist.from_samples(t_mean)>>> n_fmean=statistics.NormalDist.from_samples(t_fmean)>>> # Look at sample mean and standard deviation>>> n_mean.mean,n_mean.stdev(0.825690647733245, 0.07788573997674526)>>> n_fmean.mean,n_fmean.stdev(0.010488564966666065, 0.0008572332785645231)>>> # Calculate the lower 1 percentile of mean>>> n_mean.quantiles(n=100)[0]0.6445013221202459

In this example, you use timeit to measure the execution time of mean() and fmean(). To get reliable results, you let timeit execute each function 100 times, and collect 30 such time samples for each function. Based on these samples, you create two NormalDist objects. Note that if you run the code yourself, it might take up to a minute to collect the different time samples.

NormalDist has many convenient attributes and methods. See the documentation for a complete list. Inspecting .mean and .stdev, you see that the old statistics.mean() runs in 0.826 ± 0.078 seconds, while the new statistics.fmean() spends 0.0105 ± 0.0009 seconds. In other words, fmean() is about 80 times faster for these data.

If you need more advanced statistics in Python than the standard library offers, check out statsmodels and scipy.stats.

Warnings About Dangerous Syntax

Python has a SyntaxWarning which can warn about dubious syntax that is typically not a SyntaxError. Python 3.8 adds a few new ones that can help you during coding and debugging.

The difference between is and == can be confusing. The latter checks for equal values, while is is True only when objects are the same. Python 3.8 will try to warn you about cases when you should use == instead of is:

>>>
>>> # Python 3.7>>> version="3.7">>> versionis"3.7"False>>> # Python 3.8>>> version="3.8">>> versionis"3.8"<stdin>:1: SyntaxWarning: "is" with a literal. Did you mean "=="?False>>> version=="3.8"True

It’s easy to miss a comma when you’re writing out a long list, especially when formatting it vertically. Forgetting a comma in a list of tuples will give a confusing error message about tuples not being callable. Python 3.8 additionally emits a warning that points toward the real issue:

>>>
>>> [... (1,3)... (2,4)... ]<stdin>:2: SyntaxWarning: 'tuple' object is not callable; perhaps           you missed a comma?Traceback (most recent call last):
  File "<stdin>", line 2, in <module>TypeError: 'tuple' object is not callable

The warning correctly identifies the missing comma as the real culprit.

Optimizations

There are several optimizations made for Python 3.8. Some that make code run faster. Others reduce the memory footprint. For example, looking up fields in a namedtuple is significantly faster in Python 3.8 compared with Python 3.7:

>>>
>>> importcollections>>> fromtimeitimporttimeit>>> Person=collections.namedtuple("Person","name twitter")>>> raymond=Person("Raymond","@raymondh")>>> # Python 3.7>>> timeit("raymond.twitter",globals=globals())0.05876131607996285>>> # Python 3.8>>> timeit("raymond.twitter",globals=globals())0.0377705999400132

You can see that looking up .twitter on the namedtuple is 30-40% faster in Python 3.8. Lists save some space when they are initialized from iterables with a known length. This can save memory:

>>>
>>> importsys>>> # Python 3.7>>> sys.getsizeof(list(range(20191014)))181719232>>> # Python 3.8>>> sys.getsizeof(list(range(20191014)))161528168

In this case, the list uses about 11% less memory in Python 3.8 compared with Python 3.7.

Other optimizations include better performance in subprocess, faster file copying with shutil, improved default performance in pickle, and faster operator.itemgetter operations. See the official documentation for a complete list of optimizations.

So, Should You Upgrade to Python 3.8?

Let’s start with the simple answer. If you want to try out any of the new features you have seen here, then you do need to be able to use Python 3.8. Tools like pyenv and Anaconda make it easy to have several versions of Python installed side by side. Alternatively, you can run the official Python 3.8 Docker container. There is no downside to trying out Python 3.8 for yourself.

Now, for the more complicated questions. Should you upgrade your production environment to Python 3.8? Should you make your own project dependent on Python 3.8 to take advantage of the new features?

You should have very few issues running Python 3.7 code in Python 3.8. Upgrading your environment to run Python 3.8 is therefore quite safe, and you would be able to take advantage of the optimizations made in the new version. Different beta-versions of Python 3.8 have already been available for months, so hopefully most bugs are already squashed. However, if you want to be conservative, you might hold out until the first maintenance release (Python 3.8.1) is available.

Once you’ve upgraded your environment, you can start to experiment with features that are only in Python 3.8, such as assignment expressions and positional-only arguments. However, you should be conscious about whether other people depend on your code, as this will force them to upgrade their environment as well. Popular libraries will probably mostly support at least Python 3.6 for quite a while longer.

See Porting to Python 3.8 for more information about preparing your code for Python 3.8.


[ Improve Your Python With 🐍 Python Tricks 💌 – Get a short & sweet Python Trick delivered to your inbox every couple of days. >> Click here to learn more and see examples ]

Zero-with-Dot (Oleg Żero): Top three mistakes with K-Means Clustering during data analysis

$
0
0

Introduction

In this post, we will take a look at a few cases, where KMC algorithm does not perform well or may produce unintuitive results. In particular, we will look at the following scenarios:

  1. Our guess on the number of (real) clusters is off.
  2. Feature space is highly dimensional.
  3. The clusters come in strange or irregular shapes.

All of these conditions can lead to problems with K-Means, so let’s have a look.

Wrong number of clusters

To make it easier, let’s define a helper function compare, which will create and solve the clustering problem for us and then compare the results.

1
2
3
4
5
6
7
8
9
10
11
12
13
14
15
16
17
18
19
20
21
22
23
24
25
26
27
28
29
30
31
32
33
34
35
36
37
38
39
40
41
42
43
44
45
fromsklearnimportdatasetsfromsklearn.clusterimportKMeansfromsklearn.datasetsimportmake_blobs,make_circles,make_moonsfrommpl_toolkits.mplot3dimportAxes3Dimportnumpyasnpimportpandasaspdimportitertoolsdefcompare(N_features,C_centers,K_clusters,dims=[0,1],*args):data,targets=make_blobs(n_samples=n_samplesif'n_samples'inargselse400,n_features=N_features,centers=C_centers,cluster_std=cluster_stdif'cluster_std'inargselse0.5,shuffle=True,random_state=random_stateif'random_state'inargselse0)FEATS=['x'+str(x)forxinrange(N_features)]X=pd.DataFrame(data,columns=FEATS)X['cluster']= \
		KMeans(n_clusters=K_clusters,random_state=0).fit_predict(X)fig,axs=plt.subplots(1,2,figsize=(12,4))axs[0].scatter(data[:,dims[0]],data[:,dims[1]],c='white',marker='o',edgecolor='black',s=20)axs[0].set_xlabel('x{} [a.u.]'.format(dims[0]))axs[0].set_ylabel('x{} [a.u.]'.format(dims[1]))axs[0].set_title('Original dataset')axs[1].set_xlabel('x{} [a.u.]'.format(dims[0]))axs[1].set_ylabel('x{} [a.u.]'.format(dims[1]))axs[1].set_title('Applying clustering')colors=itertools.cycle(['r','g','b','m','c','y'])forkinrange(K_clusters):x=X[X['cluster']==k][FEATS].to_numpy()axs[1].scatter(x[:,dims[0]],x[:,dims[1]],color=next(colors),edgecolor='k',alpha=0.5)plt.show()

Too few clusters

/assets/mistakes-with-k-means-clustering/toofew1.png Figure 1a. Example of a 2-dimensional dataset with 4 centres, requesting 3 clusters (compare(2, 4, 3)).

Despite having distinct clusters in the data, we underestimated their number. As a consequence, some disjoint groups of data are forced to fit into one larger cluster.

Too many clusters

/assets/mistakes-with-k-means-clustering/toomany1.png Figure 1b. Example of a 2-dimensional dataset with 2 centres, requesting 4 clusters (compare(2, 2, 4)).

In contrary to the last situation, trying to wrap the data into too many clusters creates artificial boundaries within real data clusters.

High(er) dimensional data

A dataset does not need to be that high in dimentionality before we begin to see problems. Although visualization and thus somewhat analysis of high dimensional data is already challenging (cursing now…), as KMC is often used to gain insight into the data, it does not help to be presented with ambiguities.

To explain the point, let’s generate a three-dimensional dataset with clearly distinct clusters.

1
2
3
4
5
6
7
8
9
10
11
12
13
14
15
16
17
18
19
fig=plt.figure(figsize=(14,8))ax=fig.add_subplot(111,projection='3d')data,targets=make_blobs(n_samples=400,n_features=3,centers=3,cluster_std=0.5,shuffle=True,random_state=0)ax.scatter(data[:,0],data[:,1],zs=data[:,2],zdir='z',s=25,c='black',depthshade=True)ax.set_xlabel('x0 [a.u.]')ax.set_ylabel('x1 [a.u.]')ax.set_zlabel('x2 [a.u.]')ax.set_title('Original distribution.')plt.grid()plt.show()
/assets/mistakes-with-k-means-clustering/3d.png Figure 2. Example of a 3-dimensional dataset with 3 centers.

Although there are infinitely many ways we can project this 3D dataset onto 2D, there are three primary orthogonal sub-spaces:

  • x0 : x1
  • x1 : x2
  • x2 : x0

Looking at the x2 : x0 projection, the dataset looks like as if it only had two clusters. The lower-right “supercluster” is, in fact, two distinct groups and even if we guess K right (K = 3), it looks like an apparent error, despite the clusters are very localized.

/assets/mistakes-with-k-means-clustering/3dproj1.png Figure 3a. Projection on `x0 : x2` shows spurious result (compare(2, 2, 4, dims=[0, 2])).

To be sure, we have to look at the remaining projections to see the problem, literally, from different angles.

/assets/mistakes-with-k-means-clustering/3dproj2.png Figure 3b. Projection on `x1 : x2` resolves the ambiguity (compare(2, 2, 4, dims=[1, 2])).
/assets/mistakes-with-k-means-clustering/3dproj3.png Figure 3c. Projection on `x0 : x1` resolves the ambiguity (compare(2, 2, 4, dims=[0, 1])).

This makes more sense!

On the flip side, we had an incredible advantage. First, with three dimensions, we were able to plot the entire dataset. Secondly, the clusters that exist within the dataset were very distinct thus easy to spot. Finally, with three-dimensional dataset, we were facing only three standard 2D projections.

The case of N, N > 3 features, we would not be able to plot the whole dataset, and the number of 2D projections would scale quadratically with N:

not to mention that the dataset may have strangely shaped or non-localized clusters, which is our next challenge.

Irregular datasets

So far we mentioned problems that are on “our side”. We looked at a very “well-behaved” dataset and discussed issues on the analytics side. However, what about if the dataset does not fit our solution, or, our solution does not fit the problem? This is exactly the case, where data distribution comes in strange or irregular shapes.

Being presented with just this graph, we may be tricked into believing that there are only two clusters in the data. However, when plotting the remaining projections, we quickly learn that this is not true.

1
2
3
4
5
6
7
8
9
10
11
12
13
14
15
16
17
18
19
20
21
22
23
24
25
26
27
28
29
30
31
32
33
34
35
36
37
38
fig,axs=plt.subplots(1,3,figsize=(14,4))# unequal varianceX,y=make_blobs(n_samples=1400,cluster_std=[1.0,2.5,0.2],random_state=2)y_pred=KMeans(n_clusters=3,random_state=2).fit_predict(X)colors=[['r','g','b'][c]forciny_pred]axs[0].scatter(X[:,0],X[:,1],color=colors,edgecolor='k',alpha=0.5)axs[0].set_title("Unequal Variance")# anisotropically distributed dataX,y=make_blobs(n_samples=1400,random_state=156)transformation=[[0.60834549,-0.63667341],[-0.40887718,0.85253229]]X=np.dot(X,transformation)y_pred=KMeans(n_clusters=3,random_state=0).fit_predict(X)colors=[['r','g','b'][c]forciny_pred]axs[1].scatter(X[:,0],X[:,1],color=colors,edgecolor='k',alpha=0.5)axs[1].set_title("Anisotropicly Distributed Blobs")# irregular shaped dataX,y=make_moons(n_samples=1400,shuffle=True,noise=0.1,random_state=120)y_pred=KMeans(n_clusters=2,random_state=0).fit_predict(X)colors=[['r','g','b'][c]forciny_pred]axs[2].scatter(X[:,0],X[:,1],color=colors,edgecolor='k',alpha=0.5)axs[2].set_title("Irregular Shaped Data")plt.show()
/assets/mistakes-with-k-means-clustering/irregular.png Figure 4. Misleading clustering results are shown on irregular datasets.

The left graph shows data whose distribution although, Gaussian, does not have equal standard deviation. The middle graph presents anisotropic data, meaning data that is elongated along a specific axis. Finally, the right graph shows data that is completely non-Gaussian, despite organized in clear clusters.

In either case, the irregularity makes KMC algorithm underperform. Since the algorithm treats every data point equally and completely independently from other points, the algorithm fails to spot any possible continuity or local variations within a cluster. What it does is simply taking the same metrics and applying it to every point. As a result, the KMC algorithm may produce strange or counter-intuitive clustering within the data even if we guess K correctly and the features N are not that many.

Conclusions

In this post, we have discussed three main reasons for the K-Means Clustering algorithm to give us wrong answers.

  • First, as the number of clusters K needs to be decided a priori, there is a high chance that we will guess it wrongly.
  • Secondly, clustering in higher dimensional space becomes cumbersome from the analytics point of view, in which case KMC will provide us with insights that may be misleading.
  • Finally, for any irregularly shaped data, KMC is likely to artificial clusters that do not conform to common sense.

Knowing these three fallacies, KMC is still a useful tool, especially when inspecting of the data or constructing labels.

PyPy Development: PyPy v7.2 released

$
0
0
The PyPy team is proud to release the version 7.2.0 of PyPy, which includes two different interpreters:
  • PyPy2.7, which is an interpreter supporting the syntax and the features of Python 2.7 including the stdlib for CPython 2.7.13
  • PyPy3.6: which is an interpreter supporting the syntax and the features of Python 3.6, including the stdlib for CPython 3.6.9.
The interpreters are based on much the same codebase, thus the double release.

As always, this release is 100% compatible with the previous one and fixed several issues and bugs raised by the growing community of PyPy users. We strongly recommend updating. Many of the fixes are the direct result of end-user bug reports, so please continue reporting issues as they crop up.

You can download the v7.2 releases here:
With the support of Arm Holdings Ltd. and Crossbar.io, this release supports the 64-bit aarch64 ARM architecture. More about the work and the performance data around this welcome development can be found in the blog post.

This release removes the “beta” tag from PyPy3.6. While there may still be some small corner-case incompatibilities (around the exact error messages in exceptions and the handling of faulty codec errorhandlers) we are happy with the quality of the 3.6 series and are looking forward to working on a Python 3.7 interpreter.

We updated our benchmark runner at https://speed.pypy.org to a more modern machine and updated the baseline python to CPython 2.7.11. Thanks to Baroque Software for maintaining the benchmark runner.

The CFFI-based _ssl module was backported to PyPy2.7 and updated to use cryptography version 2.7. Additionally, the _hashlib, and crypt (or _crypt on Python3) modules were converted to CFFI. This has two consequences: end users and packagers can more easily update these libraries for their platform by executing (cdlib_pypy;../bin/pypy_*_build.py). More significantly, since PyPy itself links to fewer system shared objects (DLLs), on platforms with a single runtime namespace like linux, different CFFI and c-extension modules can load different versions of the same shared object into PyPy without collision (issue 2617).

Until downstream providers begin to distribute c-extension builds with PyPy, we have made packages for some common packages available as wheels.

The CFFI backend has been updated to version 1.13.0. We recommend using CFFI rather than c-extensions to interact with C, and cppyy for interacting with C++ code.

Thanks to Anvil, we revived the PyPy Sandbox, (soon to be released) which allows total control over a Python interpreter’s interactions with the external world.

We implemented a new JSON decoder that is much faster, uses less memory, and uses a JIT-friendly specialized dictionary. More about that in the recent blog post

We would like to thank our donors for the continued support of the PyPy project. If PyPy is not quite good enough for your needs, we are available for direct consulting work.
We would also like to thank our contributors and encourage new people to join the project. PyPy has many layers and we need help with all of them: PyPy and RPython documentation improvements, tweaking popular modules to run on PyPy, or general help with making RPython’s JIT even better. Since the previous release, we have accepted contributions from 27 new contributors, so thanks for pitching in.

What is PyPy?

PyPy is a very compliant Python interpreter, almost a drop-in replacement for CPython 2.7, 3.6. It’s fast (PyPy and CPython 2.7.x performance comparison) due to its integrated tracing JIT compiler.

We also welcome developers of other dynamic languages to see what RPython can do for them.

This PyPy release supports:
  • x86 machines on most common operating systems (Linux 32/64 bit, Mac OS X 64-bit, Windows 32-bit, OpenBSD, FreeBSD)
  • big- and little-endian variants of PPC64 running Linux
  • s390x running Linux
  • 64-bit ARM machines running Linux
Unfortunately at the moment of writing our ARM buildbots are out of service, so for now we are not releasing any binary for the ARM architecture (32-bit), although PyPy does support ARM 32-bit processors.

What else is new?

PyPy 7.1 was released in March, 2019. There are many incremental improvements to RPython and PyPy, For more information about the 7.2.0 release, see the full changelog.

Please update, and continue to help us make PyPy better.

Cheers,
The PyPy team


Python Insider: Python 3.8.0 is now available

$
0
0
On behalf of the Python development community and the Python 3.8 release team, I’m pleased to announce the availability of Python 3.8.0.

Python 3.8.0 is the newest feature release of the Python language, and it contains many new features and optimizations. You can find Python 3.8.0 here:
https://www.python.org/downloads/release/python-380/

Most third-party distributors of Python should be making 3.8.0 packages available soon.

See the “What’s New in Python 3.8” document for more information about features included in the 3.8 series. Detailed information about all changes made in 3.8.0 can be found in its change log.

Maintenance releases for the 3.8 series will follow at regular bi-monthly intervals starting in December of 2019.

We hope you enjoy Python 3.8!

Thanks to all of the many volunteers who help make Python Development and these releases possible! Please consider supporting our efforts by volunteering yourself or through organization contributions to the Python Software Foundation:
https://www.python.org/psf/

Podcast.__init__: Andrew's Adventures In Coderland

$
0
0
Software development is a unique profession in many ways, and it has given rise to its own subculture due to the unique sets of challenges that face developers. Andrew Smith is an author who is working on a book to share his experiences learning to program, and understand the impact that software is having on our world. In this episode he shares his thoughts on programmer culture, his experiences with Python and other language communities, and how learning to code has changed his views on the world. It was interesting getting an anthropological perspective from a relative newcomer to the world of software.

Summary

Software development is a unique profession in many ways, and it has given rise to its own subculture due to the unique sets of challenges that face developers. Andrew Smith is an author who is working on a book to share his experiences learning to program, and understand the impact that software is having on our world. In this episode he shares his thoughts on programmer culture, his experiences with Python and other language communities, and how learning to code has changed his views on the world. It was interesting getting an anthropological perspective from a relative newcomer to the world of software.

Announcements

  • Hello and welcome to Podcast.__init__, the podcast about Python and the people who make it great.
  • When you’re ready to launch your next app or want to try a project you hear about on the show, you’ll need somewhere to deploy it, so take a look at our friends over at Linode. With 200 Gbit/s private networking, scalable shared block storage, node balancers, and a 40 Gbit/s public network, all controlled by a brand new API you’ve got everything you need to scale up. And for your tasks that need fast computation, such as training machine learning models, they just launched dedicated CPU instances. Go to pythonpodcast.com/linode to get a $20 credit and launch a new server in under a minute. And don’t forget to thank them for their continued support of this show!
  • You listen to this show to learn and stay up to date with the ways that Python is being used, including the latest in machine learning and data analysis. For even more opportunities to meet, listen, and learn from your peers you don’t want to miss out on this year’s conference season. We have partnered with organizations such as O’Reilly Media, Dataversity, Corinium Global Intelligence, and Data Council. Upcoming events include the combined events of the Data Architecture Summit and Graphorum, Data Council in Barcelona, and the Data Orchestration Summit. Go to pythonpodcast.com/conferences to learn more about these and other events, and take advantage of our partner discounts to save money when you register today.
  • Your host as usual is Tobias Macey and today I’m interviewing Andrew Smith about his anthropological study of software engineering culture in his upcoming book Adventures In Coderland.

Interview

  • Introductions
  • How did you get introduced to Python?
  • Can you start by describing the scope and intent of your work on Adventures In Coderland?
  • What was your motivation for embarking on this particular project?
  • Prior to the start of your research for this book, what was your level of familiarity with software development as a discipline and a cultural phenomenon?
  • How are you approaching the research for this book and to what level of detail are you trying to address the problem space?
  • What are some of the most striking contrasts that you have identified between software engineers and coding culture as it compares to that of a layperson?
  • We met at the most recent PyCon US, which I understand you attended as a means of conducting research for your book. What are some of the notable aspects of the Python community that you discovered while you were attending?
  • What are some of the other programming communities that you have engaged with?
    • What are some of the differentiating factors that you have noticed between the communities that you have interacted with?
  • What are some of the most surprising discoveries that you have made in the process of writing this book?
  • What is your metric for determining when you have gathered enough raw material to complete the book?
  • Now that you have delved into the peculiarities of "coderland", how has it changed your own outlook on both the software industry, and society at large?
  • What advice do you have for the engineers who are listening as it pertains to your experiences in writing your book?

Keep In Touch

Picks

Closing Announcements

  • Thank you for listening! Don’t forget to check out our other show, the Data Engineering Podcast for the latest on modern data management.
  • Visit the site to subscribe to the show, sign up for the mailing list, and read the show notes.
  • If you’ve learned something or tried out a project from the show then tell us about it! Email hosts@podcastinit.com) with your story.
  • To help other people find the show please leave a review on iTunes and tell your friends and co-workers
  • Join the community in the new Zulip chat workspace at pythonpodcast.com/chat

Linksj

The intro and outro music is from Requiem for a Fish The Freak Fandango Orchestra / CC BY-SA

Vladimir Iakolev: Analysing music habits with Spotify API and Python

$
0
0

Hero image

I’m using Spotify since 2013 as the main source of music, and back at that time the app automatically created a playlist for songs that I liked from artists’ radios. By innertion I’m still using the playlist to save songs that I like. As the playlist became a bit big and a bit old (6 years, huh), I’ve decided to try to analyze it.

Boring preparation

To get the data I used Spotify API and spotipy as a Python client. I’ve created an application in the Spotify Dashboard and gathered the credentials. Then I was able to initialize and authorize the client:

importspotipyimportspotipy.utilasutiltoken=util.prompt_for_user_token(user_id,'playlist-read-collaborative',client_id=client_id,client_secret=client_secret,redirect_uri='http://localhost:8000/')sp=spotipy.Spotify(auth=token)

Tracks metadata

As everything is inside just one playlist, it was easy to gather. The only problem was that user_playlist method in spotipy doesn’t support pagination and can only return the first 100 track, but it was easily solved by just going down to private and undocumented _get:

playlist=sp.user_playlist(user_id,playlist_id)tracks=playlist['tracks']['items']next_uri=playlist['tracks']['next']for_inrange(int(playlist['tracks']['total']/playlist['tracks']['limit'])):response=sp._get(next_uri)tracks+=response['items']next_uri=response['next']tracks_df=pd.DataFrame([(track['track']['id'],track['track']['artists'][0]['name'],track['track']['name'],parse_date(track['track']['album']['release_date'])iftrack['track']['album']['release_date']elseNone,parse_date(track['added_at']))fortrackinplaylist['tracks']['items']],columns=['id','artist','name','release_date','added_at'])
tracks_df.head(10)
idartistnamerelease_dateadded_at
01MLtdVIDLdupSO1PzNNIQgLindstrøm & ChristabelleLooking For What2009-12-112013-06-19 08:28:56+00:00
11gWsh0T1gi55K45TMGZxT0Au Revoir SimoneKnight Of Wands - Dam Mantle Remix2010-07-042013-06-19 08:48:30+00:00
20LE3YWM0W9OWputCB8Z3qtFever RayWhen I Grow Up - D. Lissvik Version2010-10-022013-06-19 22:09:15+00:00
35FyiyLzbZt41IpWyMuiiQyHoly Ghost!Dumb Disco Ideas2013-05-142013-06-19 22:12:42+00:00
45cgfva649kw89xznFpWCFdNouvelle VagueToo Drunk To Fuck2004-11-012013-06-19 22:22:54+00:00
53IVc3QK63DngBdW7eVker2TR/STF.T.F.2012-11-162013-06-20 11:50:58+00:00
60mbpEDdZHNMEDll6woEy8WArt BrutMy Little Brother2005-10-022013-06-20 13:58:19+00:00
72y8IhUDSpvsuuEePNLjGg5Niki & The DoveSomebody (drum machine version)2011-06-142013-06-21 09:28:40+00:00
81X4RqFAShNL8aHfUIpjIVrGorillazKids with Guns - Hot Chip Remix2007-11-192013-06-23 19:00:57+00:00
91cV4DVeAM5AstrDlXgvzJ7Lykke LiI'm Good, I'm Gone2008-01-282013-06-23 22:31:52+00:00

The first naive idea of data to get was the list of the most appearing artists:

tracks_df \
    .groupby('artist') \
    .count()['id'] \
    .reset_index() \
    .sort_values('id',ascending=False) \
    .rename(columns={'id':'amount'}) \
    .head(10)
artistamount
260Pet Shop Boys12
334The Knife11
213Metronomy9
303Soulwax8
284Röyksopp7
180Ladytron7
94Depeche Mode7
113Fever Ray6
324The Chemical Brothers6
233New Order6

But as taste can change, I’ve decided to get top five artists from each year and check if I was adding them to the playlist in other years:

counted_year_df=tracks_df \
    .assign(year_added=tracks_df.added_at.dt.year) \
    .groupby(['artist','year_added']) \
    .count()['id'] \
    .reset_index() \
    .rename(columns={'id':'amount'}) \
    .sort_values('amount',ascending=False)in_top_5_year_artist=counted_year_df \
    .groupby('year_added') \
    .head(5) \
    .artist \
    .unique()counted_year_df \
    [counted_year_df.artist.isin(in_top_5_year_artist)] \
    .pivot('artist','year_added','amount') \
    .fillna(0) \
    .style.background_gradient()
#T_86ce1a46_e565_11e9_86bb_acde48001122row0_col0 { background-color: #9cb9d9; color: #000000; } #T_86ce1a46_e565_11e9_86bb_acde48001122row0_col1 { background-color: #fff7fb; color: #000000; } #T_86ce1a46_e565_11e9_86bb_acde48001122row0_col2 { background-color: #fff7fb; color: #000000; } #T_86ce1a46_e565_11e9_86bb_acde48001122row0_col3 { background-color: #e3e0ee; color: #000000; } #T_86ce1a46_e565_11e9_86bb_acde48001122row0_col4 { background-color: #4295c3; color: #000000; } #T_86ce1a46_e565_11e9_86bb_acde48001122row0_col5 { background-color: #fff7fb; color: #000000; } #T_86ce1a46_e565_11e9_86bb_acde48001122row0_col6 { background-color: #fff7fb; color: #000000; } #T_86ce1a46_e565_11e9_86bb_acde48001122row1_col0 { background-color: #dbdaeb; color: #000000; } #T_86ce1a46_e565_11e9_86bb_acde48001122row1_col1 { background-color: #fff7fb; color: #000000; } #T_86ce1a46_e565_11e9_86bb_acde48001122row1_col2 { background-color: #fff7fb; color: #000000; } #T_86ce1a46_e565_11e9_86bb_acde48001122row1_col3 { background-color: #b4c4df; color: #000000; } #T_86ce1a46_e565_11e9_86bb_acde48001122row1_col4 { background-color: #fff7fb; color: #000000; } #T_86ce1a46_e565_11e9_86bb_acde48001122row1_col5 { background-color: #fff7fb; color: #000000; } #T_86ce1a46_e565_11e9_86bb_acde48001122row1_col6 { background-color: #d0d1e6; color: #000000; } #T_86ce1a46_e565_11e9_86bb_acde48001122row2_col0 { background-color: #fff7fb; color: #000000; } #T_86ce1a46_e565_11e9_86bb_acde48001122row2_col1 { background-color: #fff7fb; color: #000000; } #T_86ce1a46_e565_11e9_86bb_acde48001122row2_col2 { background-color: #73a9cf; color: #000000; } #T_86ce1a46_e565_11e9_86bb_acde48001122row2_col3 { background-color: #b4c4df; color: #000000; } #T_86ce1a46_e565_11e9_86bb_acde48001122row2_col4 { background-color: #fff7fb; color: #000000; } #T_86ce1a46_e565_11e9_86bb_acde48001122row2_col5 { background-color: #fff7fb; color: #000000; } #T_86ce1a46_e565_11e9_86bb_acde48001122row2_col6 { background-color: #fff7fb; color: #000000; } #T_86ce1a46_e565_11e9_86bb_acde48001122row3_col0 { background-color: #dbdaeb; color: #000000; } #T_86ce1a46_e565_11e9_86bb_acde48001122row3_col1 { background-color: #fff7fb; color: #000000; } #T_86ce1a46_e565_11e9_86bb_acde48001122row3_col2 { background-color: #056faf; color: #f1f1f1; } #T_86ce1a46_e565_11e9_86bb_acde48001122row3_col3 { background-color: #e3e0ee; color: #000000; } #T_86ce1a46_e565_11e9_86bb_acde48001122row3_col4 { background-color: #fff7fb; color: #000000; } #T_86ce1a46_e565_11e9_86bb_acde48001122row3_col5 { background-color: #2685bb; color: #000000; } #T_86ce1a46_e565_11e9_86bb_acde48001122row3_col6 { background-color: #fff7fb; color: #000000; } #T_86ce1a46_e565_11e9_86bb_acde48001122row4_col0 { background-color: #dbdaeb; color: #000000; } #T_86ce1a46_e565_11e9_86bb_acde48001122row4_col1 { background-color: #b4c4df; color: #000000; } #T_86ce1a46_e565_11e9_86bb_acde48001122row4_col2 { background-color: #fff7fb; color: #000000; } #T_86ce1a46_e565_11e9_86bb_acde48001122row4_col3 { background-color: #fff7fb; color: #000000; } #T_86ce1a46_e565_11e9_86bb_acde48001122row4_col4 { background-color: #fff7fb; color: #000000; } #T_86ce1a46_e565_11e9_86bb_acde48001122row4_col5 { background-color: #b4c4df; color: #000000; } #T_86ce1a46_e565_11e9_86bb_acde48001122row4_col6 { background-color: #fff7fb; color: #000000; } #T_86ce1a46_e565_11e9_86bb_acde48001122row5_col0 { background-color: #4295c3; color: #000000; } #T_86ce1a46_e565_11e9_86bb_acde48001122row5_col1 { background-color: #d0d1e6; color: #000000; } #T_86ce1a46_e565_11e9_86bb_acde48001122row5_col2 { background-color: #fff7fb; color: #000000; } #T_86ce1a46_e565_11e9_86bb_acde48001122row5_col3 { background-color: #fff7fb; color: #000000; } #T_86ce1a46_e565_11e9_86bb_acde48001122row5_col4 { background-color: #fff7fb; color: #000000; } #T_86ce1a46_e565_11e9_86bb_acde48001122row5_col5 { background-color: #fff7fb; color: #000000; } #T_86ce1a46_e565_11e9_86bb_acde48001122row5_col6 { background-color: #fff7fb; color: #000000; } #T_86ce1a46_e565_11e9_86bb_acde48001122row6_col0 { background-color: #4295c3; color: #000000; } #T_86ce1a46_e565_11e9_86bb_acde48001122row6_col1 { background-color: #fff7fb; color: #000000; } #T_86ce1a46_e565_11e9_86bb_acde48001122row6_col2 { background-color: #fff7fb; color: #000000; } #T_86ce1a46_e565_11e9_86bb_acde48001122row6_col3 { background-color: #fff7fb; color: #000000; } #T_86ce1a46_e565_11e9_86bb_acde48001122row6_col4 { background-color: #fff7fb; color: #000000; } #T_86ce1a46_e565_11e9_86bb_acde48001122row6_col5 { background-color: #fff7fb; color: #000000; } #T_86ce1a46_e565_11e9_86bb_acde48001122row6_col6 { background-color: #fff7fb; color: #000000; } #T_86ce1a46_e565_11e9_86bb_acde48001122row7_col0 { background-color: #4295c3; color: #000000; } #T_86ce1a46_e565_11e9_86bb_acde48001122row7_col1 { background-color: #f2ecf5; color: #000000; } #T_86ce1a46_e565_11e9_86bb_acde48001122row7_col2 { background-color: #d0d1e6; color: #000000; } #T_86ce1a46_e565_11e9_86bb_acde48001122row7_col3 { background-color: #fff7fb; color: #000000; } #T_86ce1a46_e565_11e9_86bb_acde48001122row7_col4 { background-color: #dbdaeb; color: #000000; } #T_86ce1a46_e565_11e9_86bb_acde48001122row7_col5 { background-color: #fff7fb; color: #000000; } #T_86ce1a46_e565_11e9_86bb_acde48001122row7_col6 { background-color: #fff7fb; color: #000000; } #T_86ce1a46_e565_11e9_86bb_acde48001122row8_col0 { background-color: #dbdaeb; color: #000000; } #T_86ce1a46_e565_11e9_86bb_acde48001122row8_col1 { background-color: #fff7fb; color: #000000; } #T_86ce1a46_e565_11e9_86bb_acde48001122row8_col2 { background-color: #056faf; color: #f1f1f1; } #T_86ce1a46_e565_11e9_86bb_acde48001122row8_col3 { background-color: #e3e0ee; color: #000000; } #T_86ce1a46_e565_11e9_86bb_acde48001122row8_col4 { background-color: #fff7fb; color: #000000; } #T_86ce1a46_e565_11e9_86bb_acde48001122row8_col5 { background-color: #fff7fb; color: #000000; } #T_86ce1a46_e565_11e9_86bb_acde48001122row8_col6 { background-color: #fff7fb; color: #000000; } #T_86ce1a46_e565_11e9_86bb_acde48001122row9_col0 { background-color: #dbdaeb; color: #000000; } #T_86ce1a46_e565_11e9_86bb_acde48001122row9_col1 { background-color: #fff7fb; color: #000000; } #T_86ce1a46_e565_11e9_86bb_acde48001122row9_col2 { background-color: #fff7fb; color: #000000; } #T_86ce1a46_e565_11e9_86bb_acde48001122row9_col3 { background-color: #fff7fb; color: #000000; } #T_86ce1a46_e565_11e9_86bb_acde48001122row9_col4 { background-color: #4295c3; color: #000000; } #T_86ce1a46_e565_11e9_86bb_acde48001122row9_col5 { background-color: #b4c4df; color: #000000; } #T_86ce1a46_e565_11e9_86bb_acde48001122row9_col6 { background-color: #d0d1e6; color: #000000; } #T_86ce1a46_e565_11e9_86bb_acde48001122row10_col0 { background-color: #fff7fb; color: #000000; } #T_86ce1a46_e565_11e9_86bb_acde48001122row10_col1 { background-color: #fff7fb; color: #000000; } #T_86ce1a46_e565_11e9_86bb_acde48001122row10_col2 { background-color: #fff7fb; color: #000000; } #T_86ce1a46_e565_11e9_86bb_acde48001122row10_col3 { background-color: #fff7fb; color: #000000; } #T_86ce1a46_e565_11e9_86bb_acde48001122row10_col4 { background-color: #4295c3; color: #000000; } #T_86ce1a46_e565_11e9_86bb_acde48001122row10_col5 { background-color: #b4c4df; color: #000000; } #T_86ce1a46_e565_11e9_86bb_acde48001122row10_col6 { background-color: #fff7fb; color: #000000; } #T_86ce1a46_e565_11e9_86bb_acde48001122row11_col0 { background-color: #fff7fb; color: #000000; } #T_86ce1a46_e565_11e9_86bb_acde48001122row11_col1 { background-color: #fff7fb; color: #000000; } #T_86ce1a46_e565_11e9_86bb_acde48001122row11_col2 { background-color: #023858; color: #f1f1f1; } #T_86ce1a46_e565_11e9_86bb_acde48001122row11_col3 { background-color: #fff7fb; color: #000000; } #T_86ce1a46_e565_11e9_86bb_acde48001122row11_col4 { background-color: #fff7fb; color: #000000; } #T_86ce1a46_e565_11e9_86bb_acde48001122row11_col5 { background-color: #fff7fb; color: #000000; } #T_86ce1a46_e565_11e9_86bb_acde48001122row11_col6 { background-color: #d0d1e6; color: #000000; } #T_86ce1a46_e565_11e9_86bb_acde48001122row12_col0 { background-color: #fff7fb; color: #000000; } #T_86ce1a46_e565_11e9_86bb_acde48001122row12_col1 { background-color: #fff7fb; color: #000000; } #T_86ce1a46_e565_11e9_86bb_acde48001122row12_col2 { background-color: #fff7fb; color: #000000; } #T_86ce1a46_e565_11e9_86bb_acde48001122row12_col3 { background-color: #fff7fb; color: #000000; } #T_86ce1a46_e565_11e9_86bb_acde48001122row12_col4 { background-color: #fff7fb; color: #000000; } #T_86ce1a46_e565_11e9_86bb_acde48001122row12_col5 { background-color: #fff7fb; color: #000000; } #T_86ce1a46_e565_11e9_86bb_acde48001122row12_col6 { background-color: #73a9cf; color: #000000; } #T_86ce1a46_e565_11e9_86bb_acde48001122row13_col0 { background-color: #fff7fb; color: #000000; } #T_86ce1a46_e565_11e9_86bb_acde48001122row13_col1 { background-color: #fff7fb; color: #000000; } #T_86ce1a46_e565_11e9_86bb_acde48001122row13_col2 { background-color: #d0d1e6; color: #000000; } #T_86ce1a46_e565_11e9_86bb_acde48001122row13_col3 { background-color: #fff7fb; color: #000000; } #T_86ce1a46_e565_11e9_86bb_acde48001122row13_col4 { background-color: #4295c3; color: #000000; } #T_86ce1a46_e565_11e9_86bb_acde48001122row13_col5 { background-color: #fff7fb; color: #000000; } #T_86ce1a46_e565_11e9_86bb_acde48001122row13_col6 { background-color: #fff7fb; color: #000000; } #T_86ce1a46_e565_11e9_86bb_acde48001122row14_col0 { background-color: #023858; color: #f1f1f1; } #T_86ce1a46_e565_11e9_86bb_acde48001122row14_col1 { background-color: #f2ecf5; color: #000000; } #T_86ce1a46_e565_11e9_86bb_acde48001122row14_col2 { background-color: #fff7fb; color: #000000; } #T_86ce1a46_e565_11e9_86bb_acde48001122row14_col3 { background-color: #fff7fb; color: #000000; } #T_86ce1a46_e565_11e9_86bb_acde48001122row14_col4 { background-color: #fff7fb; color: #000000; } #T_86ce1a46_e565_11e9_86bb_acde48001122row14_col5 { background-color: #b4c4df; color: #000000; } #T_86ce1a46_e565_11e9_86bb_acde48001122row14_col6 { background-color: #fff7fb; color: #000000; } #T_86ce1a46_e565_11e9_86bb_acde48001122row15_col0 { background-color: #fff7fb; color: #000000; } #T_86ce1a46_e565_11e9_86bb_acde48001122row15_col1 { background-color: #fff7fb; color: #000000; } #T_86ce1a46_e565_11e9_86bb_acde48001122row15_col2 { background-color: #fff7fb; color: #000000; } #T_86ce1a46_e565_11e9_86bb_acde48001122row15_col3 { background-color: #fff7fb; color: #000000; } #T_86ce1a46_e565_11e9_86bb_acde48001122row15_col4 { background-color: #fff7fb; color: #000000; } #T_86ce1a46_e565_11e9_86bb_acde48001122row15_col5 { background-color: #fff7fb; color: #000000; } #T_86ce1a46_e565_11e9_86bb_acde48001122row15_col6 { background-color: #73a9cf; color: #000000; } #T_86ce1a46_e565_11e9_86bb_acde48001122row16_col0 { background-color: #fff7fb; color: #000000; } #T_86ce1a46_e565_11e9_86bb_acde48001122row16_col1 { background-color: #fff7fb; color: #000000; } #T_86ce1a46_e565_11e9_86bb_acde48001122row16_col2 { background-color: #fff7fb; color: #000000; } #T_86ce1a46_e565_11e9_86bb_acde48001122row16_col3 { background-color: #fff7fb; color: #000000; } #T_86ce1a46_e565_11e9_86bb_acde48001122row16_col4 { background-color: #fff7fb; color: #000000; } #T_86ce1a46_e565_11e9_86bb_acde48001122row16_col5 { background-color: #fff7fb; color: #000000; } #T_86ce1a46_e565_11e9_86bb_acde48001122row16_col6 { background-color: #73a9cf; color: #000000; } #T_86ce1a46_e565_11e9_86bb_acde48001122row17_col0 { background-color: #fff7fb; color: #000000; } #T_86ce1a46_e565_11e9_86bb_acde48001122row17_col1 { background-color: #f2ecf5; color: #000000; } #T_86ce1a46_e565_11e9_86bb_acde48001122row17_col2 { background-color: #fff7fb; color: #000000; } #T_86ce1a46_e565_11e9_86bb_acde48001122row17_col3 { background-color: #023858; color: #f1f1f1; } #T_86ce1a46_e565_11e9_86bb_acde48001122row17_col4 { background-color: #fff7fb; color: #000000; } #T_86ce1a46_e565_11e9_86bb_acde48001122row17_col5 { background-color: #b4c4df; color: #000000; } #T_86ce1a46_e565_11e9_86bb_acde48001122row17_col6 { background-color: #d0d1e6; color: #000000; } #T_86ce1a46_e565_11e9_86bb_acde48001122row18_col0 { background-color: #fff7fb; color: #000000; } #T_86ce1a46_e565_11e9_86bb_acde48001122row18_col1 { background-color: #b4c4df; color: #000000; } #T_86ce1a46_e565_11e9_86bb_acde48001122row18_col2 { background-color: #fff7fb; color: #000000; } #T_86ce1a46_e565_11e9_86bb_acde48001122row18_col3 { background-color: #fff7fb; color: #000000; } #T_86ce1a46_e565_11e9_86bb_acde48001122row18_col4 { background-color: #dbdaeb; color: #000000; } #T_86ce1a46_e565_11e9_86bb_acde48001122row18_col5 { background-color: #fff7fb; color: #000000; } #T_86ce1a46_e565_11e9_86bb_acde48001122row18_col6 { background-color: #fff7fb; color: #000000; } #T_86ce1a46_e565_11e9_86bb_acde48001122row19_col0 { background-color: #fff7fb; color: #000000; } #T_86ce1a46_e565_11e9_86bb_acde48001122row19_col1 { background-color: #fff7fb; color: #000000; } #T_86ce1a46_e565_11e9_86bb_acde48001122row19_col2 { background-color: #fff7fb; color: #000000; } #T_86ce1a46_e565_11e9_86bb_acde48001122row19_col3 { background-color: #e3e0ee; color: #000000; } #T_86ce1a46_e565_11e9_86bb_acde48001122row19_col4 { background-color: #fff7fb; color: #000000; } #T_86ce1a46_e565_11e9_86bb_acde48001122row19_col5 { background-color: #023858; color: #f1f1f1; } #T_86ce1a46_e565_11e9_86bb_acde48001122row19_col6 { background-color: #fff7fb; color: #000000; } #T_86ce1a46_e565_11e9_86bb_acde48001122row20_col0 { background-color: #dbdaeb; color: #000000; } #T_86ce1a46_e565_11e9_86bb_acde48001122row20_col1 { background-color: #96b6d7; color: #000000; } #T_86ce1a46_e565_11e9_86bb_acde48001122row20_col2 { background-color: #fff7fb; color: #000000; } #T_86ce1a46_e565_11e9_86bb_acde48001122row20_col3 { background-color: #fff7fb; color: #000000; } #T_86ce1a46_e565_11e9_86bb_acde48001122row20_col4 { background-color: #fff7fb; color: #000000; } #T_86ce1a46_e565_11e9_86bb_acde48001122row20_col5 { background-color: #fff7fb; color: #000000; } #T_86ce1a46_e565_11e9_86bb_acde48001122row20_col6 { background-color: #fff7fb; color: #000000; } #T_86ce1a46_e565_11e9_86bb_acde48001122row21_col0 { background-color: #fff7fb; color: #000000; } #T_86ce1a46_e565_11e9_86bb_acde48001122row21_col1 { background-color: #023858; color: #f1f1f1; } #T_86ce1a46_e565_11e9_86bb_acde48001122row21_col2 { background-color: #fff7fb; color: #000000; } #T_86ce1a46_e565_11e9_86bb_acde48001122row21_col3 { background-color: #fff7fb; color: #000000; } #T_86ce1a46_e565_11e9_86bb_acde48001122row21_col4 { background-color: #fff7fb; color: #000000; } #T_86ce1a46_e565_11e9_86bb_acde48001122row21_col5 { background-color: #fff7fb; color: #000000; } #T_86ce1a46_e565_11e9_86bb_acde48001122row21_col6 { background-color: #fff7fb; color: #000000; } #T_86ce1a46_e565_11e9_86bb_acde48001122row22_col0 { background-color: #fff7fb; color: #000000; } #T_86ce1a46_e565_11e9_86bb_acde48001122row22_col1 { background-color: #b4c4df; color: #000000; } #T_86ce1a46_e565_11e9_86bb_acde48001122row22_col2 { background-color: #fff7fb; color: #000000; } #T_86ce1a46_e565_11e9_86bb_acde48001122row22_col3 { background-color: #73a9cf; color: #000000; } #T_86ce1a46_e565_11e9_86bb_acde48001122row22_col4 { background-color: #fff7fb; color: #000000; } #T_86ce1a46_e565_11e9_86bb_acde48001122row22_col5 { background-color: #fff7fb; color: #000000; } #T_86ce1a46_e565_11e9_86bb_acde48001122row22_col6 { background-color: #fff7fb; color: #000000; } #T_86ce1a46_e565_11e9_86bb_acde48001122row23_col0 { background-color: #fff7fb; color: #000000; } #T_86ce1a46_e565_11e9_86bb_acde48001122row23_col1 { background-color: #fff7fb; color: #000000; } #T_86ce1a46_e565_11e9_86bb_acde48001122row23_col2 { background-color: #fff7fb; color: #000000; } #T_86ce1a46_e565_11e9_86bb_acde48001122row23_col3 { background-color: #fff7fb; color: #000000; } #T_86ce1a46_e565_11e9_86bb_acde48001122row23_col4 { background-color: #dbdaeb; color: #000000; } #T_86ce1a46_e565_11e9_86bb_acde48001122row23_col5 { background-color: #fff7fb; color: #000000; } #T_86ce1a46_e565_11e9_86bb_acde48001122row23_col6 { background-color: #023858; color: #f1f1f1; } #T_86ce1a46_e565_11e9_86bb_acde48001122row24_col0 { background-color: #fff7fb; color: #000000; } #T_86ce1a46_e565_11e9_86bb_acde48001122row24_col1 { background-color: #fff7fb; color: #000000; } #T_86ce1a46_e565_11e9_86bb_acde48001122row24_col2 { background-color: #fff7fb; color: #000000; } #T_86ce1a46_e565_11e9_86bb_acde48001122row24_col3 { background-color: #fff7fb; color: #000000; } #T_86ce1a46_e565_11e9_86bb_acde48001122row24_col4 { background-color: #023858; color: #f1f1f1; } #T_86ce1a46_e565_11e9_86bb_acde48001122row24_col5 { background-color: #023858; color: #f1f1f1; } #T_86ce1a46_e565_11e9_86bb_acde48001122row24_col6 { background-color: #fff7fb; color: #000000; } #T_86ce1a46_e565_11e9_86bb_acde48001122row25_col0 { background-color: #fff7fb; color: #000000; } #T_86ce1a46_e565_11e9_86bb_acde48001122row25_col1 { background-color: #fff7fb; color: #000000; } #T_86ce1a46_e565_11e9_86bb_acde48001122row25_col2 { background-color: #056faf; color: #f1f1f1; } #T_86ce1a46_e565_11e9_86bb_acde48001122row25_col3 { background-color: #fff7fb; color: #000000; } #T_86ce1a46_e565_11e9_86bb_acde48001122row25_col4 { background-color: #fff7fb; color: #000000; } #T_86ce1a46_e565_11e9_86bb_acde48001122row25_col5 { background-color: #fff7fb; color: #000000; } #T_86ce1a46_e565_11e9_86bb_acde48001122row25_col6 { background-color: #fff7fb; color: #000000; } #T_86ce1a46_e565_11e9_86bb_acde48001122row26_col0 { background-color: #fff7fb; color: #000000; } #T_86ce1a46_e565_11e9_86bb_acde48001122row26_col1 { background-color: #fff7fb; color: #000000; } #T_86ce1a46_e565_11e9_86bb_acde48001122row26_col2 { background-color: #73a9cf; color: #000000; } #T_86ce1a46_e565_11e9_86bb_acde48001122row26_col3 { background-color: #fff7fb; color: #000000; } #T_86ce1a46_e565_11e9_86bb_acde48001122row26_col4 { background-color: #dbdaeb; color: #000000; } #T_86ce1a46_e565_11e9_86bb_acde48001122row26_col5 { background-color: #fff7fb; color: #000000; } #T_86ce1a46_e565_11e9_86bb_acde48001122row26_col6 { background-color: #056faf; color: #f1f1f1; } #T_86ce1a46_e565_11e9_86bb_acde48001122row27_col0 { background-color: #fff7fb; color: #000000; } #T_86ce1a46_e565_11e9_86bb_acde48001122row27_col1 { background-color: #fff7fb; color: #000000; } #T_86ce1a46_e565_11e9_86bb_acde48001122row27_col2 { background-color: #fff7fb; color: #000000; } #T_86ce1a46_e565_11e9_86bb_acde48001122row27_col3 { background-color: #fff7fb; color: #000000; } #T_86ce1a46_e565_11e9_86bb_acde48001122row27_col4 { background-color: #fff7fb; color: #000000; } #T_86ce1a46_e565_11e9_86bb_acde48001122row27_col5 { background-color: #2685bb; color: #000000; } #T_86ce1a46_e565_11e9_86bb_acde48001122row27_col6 { background-color: #fff7fb; color: #000000; } #T_86ce1a46_e565_11e9_86bb_acde48001122row28_col0 { background-color: #023858; color: #f1f1f1; } #T_86ce1a46_e565_11e9_86bb_acde48001122row28_col1 { background-color: #f2ecf5; color: #000000; } #T_86ce1a46_e565_11e9_86bb_acde48001122row28_col2 { background-color: #056faf; color: #f1f1f1; } #T_86ce1a46_e565_11e9_86bb_acde48001122row28_col3 { background-color: #e3e0ee; color: #000000; } #T_86ce1a46_e565_11e9_86bb_acde48001122row28_col4 { background-color: #fff7fb; color: #000000; } #T_86ce1a46_e565_11e9_86bb_acde48001122row28_col5 { background-color: #fff7fb; color: #000000; } #T_86ce1a46_e565_11e9_86bb_acde48001122row28_col6 { background-color: #d0d1e6; color: #000000; } #T_86ce1a46_e565_11e9_86bb_acde48001122row29_col0 { background-color: #fff7fb; color: #000000; } #T_86ce1a46_e565_11e9_86bb_acde48001122row29_col1 { background-color: #fff7fb; color: #000000; } #T_86ce1a46_e565_11e9_86bb_acde48001122row29_col2 { background-color: #fff7fb; color: #000000; } #T_86ce1a46_e565_11e9_86bb_acde48001122row29_col3 { background-color: #b4c4df; color: #000000; } #T_86ce1a46_e565_11e9_86bb_acde48001122row29_col4 { background-color: #fff7fb; color: #000000; } #T_86ce1a46_e565_11e9_86bb_acde48001122row29_col5 { background-color: #fff7fb; color: #000000; } #T_86ce1a46_e565_11e9_86bb_acde48001122row29_col6 { background-color: #fff7fb; color: #000000; } #T_86ce1a46_e565_11e9_86bb_acde48001122row30_col0 { background-color: #fff7fb; color: #000000; } #T_86ce1a46_e565_11e9_86bb_acde48001122row30_col1 { background-color: #fff7fb; color: #000000; } #T_86ce1a46_e565_11e9_86bb_acde48001122row30_col2 { background-color: #fff7fb; color: #000000; } #T_86ce1a46_e565_11e9_86bb_acde48001122row30_col3 { background-color: #fff7fb; color: #000000; } #T_86ce1a46_e565_11e9_86bb_acde48001122row30_col4 { background-color: #fff7fb; color: #000000; } #T_86ce1a46_e565_11e9_86bb_acde48001122row30_col5 { background-color: #2685bb; color: #000000; } #T_86ce1a46_e565_11e9_86bb_acde48001122row30_col6 { background-color: #fff7fb; color: #000000; } #T_86ce1a46_e565_11e9_86bb_acde48001122row31_col0 { background-color: #fff7fb; color: #000000; } #T_86ce1a46_e565_11e9_86bb_acde48001122row31_col1 { background-color: #fff7fb; color: #000000; } #T_86ce1a46_e565_11e9_86bb_acde48001122row31_col2 { background-color: #fff7fb; color: #000000; } #T_86ce1a46_e565_11e9_86bb_acde48001122row31_col3 { background-color: #fff7fb; color: #000000; } #T_86ce1a46_e565_11e9_86bb_acde48001122row31_col4 { background-color: #9cb9d9; color: #000000; } #T_86ce1a46_e565_11e9_86bb_acde48001122row31_col5 { background-color: #2685bb; color: #000000; } #T_86ce1a46_e565_11e9_86bb_acde48001122row31_col6 { background-color: #fff7fb; color: #000000; }
year_added2013201420152016201720182019
artist
Arcade Fire2001300
Clinic1002001
Crystal Castles0022000
Depeche Mode1031020
Die Antwoord1400010
FM Belfast3300000
Factory Floor3000000
Fever Ray3110100
Grimes1031000
Holy Ghost!1000311
Joe Goddard0000310
John Maus0040001
KOMPROMAT0000002
LCD Soundsystem0010300
Ladytron5100010
Lindstrøm0000002
Marie Davidson0000002
Metronomy0106011
Midnight Magic0400100
Mr. Oizo0001030
New Order1500000
Pet Shop Boys01200000
Röyksopp0403000
Schwefelgelb0000104
Soulwax0000530
Talking Heads0030000
The Chemical Brothers0020103
The Fall0000020
The Knife5131001
The Normal0002000
The Prodigy0000020
Vitalic0000220

As a bunch of artists was reappearing in different years, I decided to check if that correlates with new releases, so I’ve checked the last ten years:

counted_release_year_df=tracks_df \
    .assign(year_added=tracks_df.added_at.dt.year,year_released=tracks_df.release_date.dt.year) \
    .groupby(['year_released','year_added']) \
    .count()['id'] \
    .reset_index() \
    .rename(columns={'id':'amount'}) \
    .sort_values('amount',ascending=False)counted_release_year_df \
    [counted_release_year_df.year_released.isin(sorted(tracks_df.release_date.dt.year.unique())[-11:])] \
    .pivot('year_released','year_added','amount') \
    .fillna(0) \
    .style.background_gradient()
#T_e6282bbc_e62d_11e9_86bb_acde48001122row0_col0 { background-color: #2182b9; color: #000000; } #T_e6282bbc_e62d_11e9_86bb_acde48001122row0_col1 { background-color: #cacee5; color: #000000; } #T_e6282bbc_e62d_11e9_86bb_acde48001122row0_col2 { background-color: #eae6f1; color: #000000; } #T_e6282bbc_e62d_11e9_86bb_acde48001122row0_col3 { background-color: #023858; color: #f1f1f1; } #T_e6282bbc_e62d_11e9_86bb_acde48001122row0_col4 { background-color: #cdd0e5; color: #000000; } #T_e6282bbc_e62d_11e9_86bb_acde48001122row0_col5 { background-color: #73a9cf; color: #000000; } #T_e6282bbc_e62d_11e9_86bb_acde48001122row0_col6 { background-color: #1379b5; color: #f1f1f1; } #T_e6282bbc_e62d_11e9_86bb_acde48001122row1_col0 { background-color: #73a9cf; color: #000000; } #T_e6282bbc_e62d_11e9_86bb_acde48001122row1_col1 { background-color: #b4c4df; color: #000000; } #T_e6282bbc_e62d_11e9_86bb_acde48001122row1_col2 { background-color: #cacee5; color: #000000; } #T_e6282bbc_e62d_11e9_86bb_acde48001122row1_col3 { background-color: #4295c3; color: #000000; } #T_e6282bbc_e62d_11e9_86bb_acde48001122row1_col4 { background-color: #d8d7e9; color: #000000; } #T_e6282bbc_e62d_11e9_86bb_acde48001122row1_col5 { background-color: #73a9cf; color: #000000; } #T_e6282bbc_e62d_11e9_86bb_acde48001122row1_col6 { background-color: #acc0dd; color: #000000; } #T_e6282bbc_e62d_11e9_86bb_acde48001122row2_col0 { background-color: #9fbad9; color: #000000; } #T_e6282bbc_e62d_11e9_86bb_acde48001122row2_col1 { background-color: #73a9cf; color: #000000; } #T_e6282bbc_e62d_11e9_86bb_acde48001122row2_col2 { background-color: #9cb9d9; color: #000000; } #T_e6282bbc_e62d_11e9_86bb_acde48001122row2_col3 { background-color: #73a9cf; color: #000000; } #T_e6282bbc_e62d_11e9_86bb_acde48001122row2_col4 { background-color: #afc1dd; color: #000000; } #T_e6282bbc_e62d_11e9_86bb_acde48001122row2_col5 { background-color: #dbdaeb; color: #000000; } #T_e6282bbc_e62d_11e9_86bb_acde48001122row2_col6 { background-color: #fff7fb; color: #000000; } #T_e6282bbc_e62d_11e9_86bb_acde48001122row3_col0 { background-color: #023858; color: #f1f1f1; } #T_e6282bbc_e62d_11e9_86bb_acde48001122row3_col1 { background-color: #529bc7; color: #000000; } #T_e6282bbc_e62d_11e9_86bb_acde48001122row3_col2 { background-color: #dbdaeb; color: #000000; } #T_e6282bbc_e62d_11e9_86bb_acde48001122row3_col3 { background-color: #4295c3; color: #000000; } #T_e6282bbc_e62d_11e9_86bb_acde48001122row3_col4 { background-color: #d8d7e9; color: #000000; } #T_e6282bbc_e62d_11e9_86bb_acde48001122row3_col5 { background-color: #9cb9d9; color: #000000; } #T_e6282bbc_e62d_11e9_86bb_acde48001122row3_col6 { background-color: #e8e4f0; color: #000000; } #T_e6282bbc_e62d_11e9_86bb_acde48001122row4_col0 { background-color: #fff7fb; color: #000000; } #T_e6282bbc_e62d_11e9_86bb_acde48001122row4_col1 { background-color: #023858; color: #f1f1f1; } #T_e6282bbc_e62d_11e9_86bb_acde48001122row4_col2 { background-color: #eae6f1; color: #000000; } #T_e6282bbc_e62d_11e9_86bb_acde48001122row4_col3 { background-color: #f0eaf4; color: #000000; } #T_e6282bbc_e62d_11e9_86bb_acde48001122row4_col4 { background-color: #fff7fb; color: #000000; } #T_e6282bbc_e62d_11e9_86bb_acde48001122row4_col5 { background-color: #023858; color: #f1f1f1; } #T_e6282bbc_e62d_11e9_86bb_acde48001122row4_col6 { background-color: #f4eef6; color: #000000; } #T_e6282bbc_e62d_11e9_86bb_acde48001122row5_col0 { background-color: #fff7fb; color: #000000; } #T_e6282bbc_e62d_11e9_86bb_acde48001122row5_col1 { background-color: #fff7fb; color: #000000; } #T_e6282bbc_e62d_11e9_86bb_acde48001122row5_col2 { background-color: #023858; color: #f1f1f1; } #T_e6282bbc_e62d_11e9_86bb_acde48001122row5_col3 { background-color: #73a9cf; color: #000000; } #T_e6282bbc_e62d_11e9_86bb_acde48001122row5_col4 { background-color: #afc1dd; color: #000000; } #T_e6282bbc_e62d_11e9_86bb_acde48001122row5_col5 { background-color: #187cb6; color: #000000; } #T_e6282bbc_e62d_11e9_86bb_acde48001122row5_col6 { background-color: #2f8bbe; color: #000000; } #T_e6282bbc_e62d_11e9_86bb_acde48001122row6_col0 { background-color: #fff7fb; color: #000000; } #T_e6282bbc_e62d_11e9_86bb_acde48001122row6_col1 { background-color: #fff7fb; color: #000000; } #T_e6282bbc_e62d_11e9_86bb_acde48001122row6_col2 { background-color: #fff7fb; color: #000000; } #T_e6282bbc_e62d_11e9_86bb_acde48001122row6_col3 { background-color: #0567a2; color: #f1f1f1; } #T_e6282bbc_e62d_11e9_86bb_acde48001122row6_col4 { background-color: #bfc9e1; color: #000000; } #T_e6282bbc_e62d_11e9_86bb_acde48001122row6_col5 { background-color: #9cb9d9; color: #000000; } #T_e6282bbc_e62d_11e9_86bb_acde48001122row6_col6 { background-color: #acc0dd; color: #000000; } #T_e6282bbc_e62d_11e9_86bb_acde48001122row7_col0 { background-color: #fff7fb; color: #000000; } #T_e6282bbc_e62d_11e9_86bb_acde48001122row7_col1 { background-color: #fff7fb; color: #000000; } #T_e6282bbc_e62d_11e9_86bb_acde48001122row7_col2 { background-color: #fff7fb; color: #000000; } #T_e6282bbc_e62d_11e9_86bb_acde48001122row7_col3 { background-color: #fff7fb; color: #000000; } #T_e6282bbc_e62d_11e9_86bb_acde48001122row7_col4 { background-color: #023858; color: #f1f1f1; } #T_e6282bbc_e62d_11e9_86bb_acde48001122row7_col5 { background-color: #73a9cf; color: #000000; } #T_e6282bbc_e62d_11e9_86bb_acde48001122row7_col6 { background-color: #acc0dd; color: #000000; } #T_e6282bbc_e62d_11e9_86bb_acde48001122row8_col0 { background-color: #fff7fb; color: #000000; } #T_e6282bbc_e62d_11e9_86bb_acde48001122row8_col1 { background-color: #fff7fb; color: #000000; } #T_e6282bbc_e62d_11e9_86bb_acde48001122row8_col2 { background-color: #fff7fb; color: #000000; } #T_e6282bbc_e62d_11e9_86bb_acde48001122row8_col3 { background-color: #fff7fb; color: #000000; } #T_e6282bbc_e62d_11e9_86bb_acde48001122row8_col4 { background-color: #fff7fb; color: #000000; } #T_e6282bbc_e62d_11e9_86bb_acde48001122row8_col5 { background-color: #9cb9d9; color: #000000; } #T_e6282bbc_e62d_11e9_86bb_acde48001122row8_col6 { background-color: #509ac6; color: #000000; } #T_e6282bbc_e62d_11e9_86bb_acde48001122row9_col0 { background-color: #fff7fb; color: #000000; } #T_e6282bbc_e62d_11e9_86bb_acde48001122row9_col1 { background-color: #fff7fb; color: #000000; } #T_e6282bbc_e62d_11e9_86bb_acde48001122row9_col2 { background-color: #fff7fb; color: #000000; } #T_e6282bbc_e62d_11e9_86bb_acde48001122row9_col3 { background-color: #fff7fb; color: #000000; } #T_e6282bbc_e62d_11e9_86bb_acde48001122row9_col4 { background-color: #fff7fb; color: #000000; } #T_e6282bbc_e62d_11e9_86bb_acde48001122row9_col5 { background-color: #fff7fb; color: #000000; } #T_e6282bbc_e62d_11e9_86bb_acde48001122row9_col6 { background-color: #023858; color: #f1f1f1; }
year_added2013201420152016201720182019
year_released
2010.01982106510
2011.0141046555
2012.0111565820
2013.0281736542
2014.0030210101
2015.000155879
2016.00008745
2017.000002355
2018.00000048
2019.000000014

Audio features

Spotify API has an endpoint that provides features like danceability, energy, loudness and etc for tracks. So I gathered features for all tracks from the playlist:

features=[]forn,chunk_seriesintracks_df.groupby(np.arange(len(tracks_df))//50).id:features+=sp.audio_features([*map(str,chunk_series)])features_df=pd.DataFrame.from_dict(filter(None,features))tracks_with_features_df=tracks_df.merge(features_df,on=['id'],how='inner')
tracks_with_features_df.head()
idartistnamerelease_dateadded_atdanceabilityenergykeyloudnessmodespeechinessacousticnessinstrumentalnesslivenessvalencetempoduration_mstime_signature
01MLtdVIDLdupSO1PzNNIQgLindstrøm & ChristabelleLooking For What2009-12-112013-06-19 08:28:56+00:000.5660.7260-11.29410.11200.041900.4940000.2820.345120.0553590914
11gWsh0T1gi55K45TMGZxT0Au Revoir SimoneKnight Of Wands - Dam Mantle Remix2010-07-042013-06-19 08:48:30+00:000.5630.5884-7.20500.06370.005730.9320000.1040.46789.4452373874
20LE3YWM0W9OWputCB8Z3qtFever RayWhen I Grow Up - D. Lissvik Version2010-10-022013-06-19 22:09:15+00:000.6870.7605-6.23610.04790.011600.0076800.4170.81892.0072701204
35FyiyLzbZt41IpWyMuiiQyHoly Ghost!Dumb Disco Ideas2013-05-142013-06-19 22:12:42+00:000.7520.83110-4.40710.04010.003270.7290000.1050.845124.2344837074
45cgfva649kw89xznFpWCFdNouvelle VagueToo Drunk To Fuck2004-11-012013-06-19 22:22:54+00:000.4610.7867-6.95010.04670.476000.0000030.4950.808159.8821361604

After that I’ve checked changes in features over time, only instrumentalness had some visible difference:

sns.boxplot(x=tracks_with_features_df.added_at.dt.year,y=tracks_with_features_df.instrumentalness)

Instrumentalness over time

Then I had an idea to check seasonality and valence, and it kind of showed that in depressing months valence is a bit lower:

sns.boxplot(x=tracks_with_features_df.added_at.dt.month,y=tracks_with_features_df.valence)

Valence seasonality

To play a bit more with data, I decided to check that danceability and valence might correlate:

tracks_with_features_df.plot(kind='scatter',x='danceability',y='valence')

Dnaceability vs valence

And to check that the data is meaningful, I checked instrumentalness vs speechiness, and those featues looked mutually exclusive as expected:

tracks_with_features_df.plot(kind='scatter',x='instrumentalness',y='speechiness')

Speachness vs instrumentalness

Tracks difference and similarity

As I already had a bunch of features classifying tracks, it was hard not to make vectors out of them:

encode_fields=['danceability','energy','key','loudness','mode','speechiness','acousticness','instrumentalness','liveness','valence','tempo','duration_ms','time_signature',]defencode(row):returnnp.array([(row[k]-tracks_with_features_df[k].min())/(tracks_with_features_df[k].max()-tracks_with_features_df[k].min())forkinencode_fields])tracks_with_features_encoded_df=tracks_with_features_df.assign(encoded=tracks_with_features_df.apply(encode,axis=1))

Then I just calculated distance between every two tracks:

tracks_with_features_encoded_product_df=tracks_with_features_encoded_df \
    .assign(temp=0) \
    .merge(tracks_with_features_encoded_df.assign(temp=0),on='temp',how='left') \
    .drop(columns='temp')tracks_with_features_encoded_product_df=tracks_with_features_encoded_product_df[tracks_with_features_encoded_product_df.id_x!=tracks_with_features_encoded_product_df.id_y]tracks_with_features_encoded_product_df['merge_id']=tracks_with_features_encoded_product_df \
    .apply(lambdarow:''.join(sorted([row['id_x'],row['id_y']])),axis=1)tracks_with_features_encoded_product_df['distance']=tracks_with_features_encoded_product_df \
    .apply(lambdarow:np.linalg.norm(row['encoded_x']-row['encoded_y']),axis=1)

After that I was able to get most similar songs/songs with the minimal distance, and it selected kind of similar songs:

tracks_with_features_encoded_product_df \
    .sort_values('distance') \
    .drop_duplicates('merge_id') \
    [['artist_x','name_x','release_date_x','artist_y','name_y','release_date_y','distance']] \
    .head(10)
artist_xname_xrelease_date_xartist_yname_yrelease_date_ydistance
84370Labyrinth EarWild Flowers2010-11-21Labyrinth EarNavy Light2010-11-210.000000
446773YACHTI Thought the Future Would Be Cooler2015-09-11ADULT.Love Lies2013-05-130.111393
21963LadytronSeventeen2011-03-29The Juan MacleanGive Me Every Little Thing2005-07-040.125358
11480Class ActressCareful What You Say2010-02-09MGMTLittle Dark Age2017-10-170.128865
261780Queen of JapanI Was Made For Loving You2001-10-02Midnight JuggernautsDevil Within2007-10-020.131304
63257PixiesBagboy2013-09-09KindnessThat's Alright2012-03-160.146897
265792DatarockComputer Camp Love2005-10-02ChromeoNight By Night2010-09-210.147235
75359Midnight JuggernautsDevil Within2007-10-02Lykke LiI'm Good, I'm Gone2008-01-280.152680
105246ADULT.Love Lies2013-05-13Dr. AlbanSing Hallelujah!1992-05-040.154475
285180GigameshDon't Stop2012-05-28Pet Shop BoysPaninaro 95 - 2003 Remaster2003-10-020.156469

The most different songs weren’t that fun, as two songs were too different from the rest:

tracks_with_features_encoded_product_df \
    .sort_values('distance',ascending=False) \
    .drop_duplicates('merge_id') \
    [['artist_x','name_x','release_date_x','artist_y','name_y','release_date_y','distance']] \
    .head(10)
artist_xname_xrelease_date_xartist_yname_yrelease_date_ydistance
79324Labyrinth EarNavy Light2010-11-21Boy HarsherModulations2014-10-012.480206
84804Labyrinth EarWild Flowers2010-11-21Boy HarsherModulations2014-10-012.480206
400840Charlotte GainsbourgDeadly Valentine - Soulwax Remix2017-11-10Labyrinth EarNavy Light2010-11-212.478183
84840Labyrinth EarWild Flowers2010-11-21Charlotte GainsbourgDeadly Valentine - Soulwax Remix2017-11-102.478183
388510LadytronPaco!2001-10-02Labyrinth EarNavy Light2010-11-212.444927
388518LadytronPaco!2001-10-02Labyrinth EarWild Flowers2010-11-212.444927
20665Factory FloorFall Back2013-01-15Labyrinth EarNavy Light2010-11-212.439136
20673Factory FloorFall Back2013-01-15Labyrinth EarWild Flowers2010-11-212.439136
79448Labyrinth EarNavy Light2010-11-21La FemmeRunway2018-10-012.423574
84928Labyrinth EarWild Flowers2010-11-21La FemmeRunway2018-10-012.423574

Then I calculated the most avarage songs, eg the songs with the least distance from every other song:

tracks_with_features_encoded_product_df \
    .groupby(['artist_x','name_x','release_date_x']) \
    .sum()['distance'] \
    .reset_index() \
    .sort_values('distance') \
    .head(10)
artist_xname_xrelease_date_xdistance
48BeirutNo Dice2009-02-17638.331257
591The Juan McLeanA Place Called Space2014-09-15643.436523
347MGMTLittle Dark Age2017-10-17645.959770
101Class ActressCareful What You Say2010-02-09646.488998
31Architecture In Helsinki2 Time2014-04-01648.692344
588The Juan MacleanGive Me Every Little Thing2005-07-04648.878463
323LindstrømBaby Can't Stop2009-10-26652.212858
307LadytronSeventeen2011-03-29652.759843
310LauerMirrors (feat. Jasnau)2018-11-16655.498535
451Pet Shop BoysAlways on My Mind1998-03-31656.437048

And totally opposite thing – the most outstanding songs:

tracks_with_features_encoded_product_df \
    .groupby(['artist_x','name_x','release_date_x']) \
    .sum()['distance'] \
    .reset_index() \
    .sort_values('distance',ascending=False) \
    .head(10)
artist_xname_xrelease_date_xdistance
665YACHTLe Goudron - Long Version2012-05-252823.572387
300Labyrinth EarNavy Light2010-11-211329.234390
301Labyrinth EarWild Flowers2010-11-211329.234390
57Blonde RedheadFor the Damaged Coda2000-06-061095.393120
616The Velvet UndergroundAfter Hours1969-03-021080.491779
593The KnifeForest Families2006-02-171040.114214
615The Space LadyMajor Tom2013-11-181016.881467
107CocoRosieBy Your Side2004-03-091015.970860
170El Perro Del MarParty2015-02-131012.163212
403Mr.KittyXIII2014-10-061010.115117

Conclusion

Although the dataset is a bit small, it was still fun to have a look at the data.

Gist with a jupyter notebook with even more boring stuff, can be reused by modifying credentials.

Programiz: Python IDEs and Code Editors

$
0
0
In this guide, you will learn about various Python IDEs and code editors for beginners and professionals.

Julien Danjou: Sending Emails in Python — Tutorial with Code Examples

$
0
0
Sending Emails in Python — Tutorial with Code Examples

What do you need to send an email with Python? Some basic programming and web knowledge along with the elementary Python skills. I assume you’ve already had a web app built with this language and now you need to extend its functionality with notifications or other emails sending. This tutorial will guide you through the most essential steps of sending emails via an SMTP server:

  1. Configuring a server for testing (do you know why it’s important?)
  2. Local SMTP server
  3. Mailtrap test SMTP server
  4. Different types of emails: HTML, with images, and attachments
  5. Sending multiple personalized emails (Python is just invaluable for email automation)
  6. Some popular email sending options like Gmail and transactional email services

Served with numerous code examples written and tested on Python 3.7!

Sending an email using an SMTP

The first good news about Python is that it has a built-in module for sending emails via SMTP in its standard library. No extra installations or tricks are required. You can import the module using the following statement:

import smtplib

To make sure that the module has been imported properly and get the full description of its classes and arguments, type in an interactive Python session:

help(smtplib)

At our next step, we will talk a bit about servers: choosing the right option and configuring it.

An SMTP server for testing emails in Python

When creating a new app or adding any functionality, especially when doing it for the first time, it’s essential to experiment on a test server. Here is a brief list of reasons:

  1. You won’t hit your friends’ and customers’ inboxes. This is vital when you test bulk email sending or work with an email database.
  2. You won’t flood your own inbox with testing emails.
  3. Your domain won’t be blacklisted for spam.

Local SMTP server

If you prefer working in the local environment, the local SMTP debugging server might be an option. For this purpose, Python offers an smtpd module. It has a DebuggingServerfeature, which will discard messages you are sending out and will print them to stdout. It is compatible with all operations systems.

Set your SMTP server to localhost:1025

python -m smtpd -n -c DebuggingServer localhost:1025

In order to run SMTP server on port 25, you’ll need root permissions:

sudo python -m smtpd -n -c DebuggingServer localhost:25

It will help you verify whether your code is working and point out the possible problems if there are any. However, it won’t give you the opportunity to check how your HTML email template is rendered.

Fake SMTP server

Fake SMTP server imitates the work of a real 3rd party web server. In further examples in this post, we will use Mailtrap. Beyond testing email sending, it will let us check how the email will  be rendered and displayed, review the message raw data as well as will provide us with a spam report. Mailtrap is very easy to set up: you will need just copy the credentials generated by the app and paste them into your code.

Sending Emails in Python — Tutorial with Code Examples

Here is how it looks in practice:

import smtplib

port = 2525
smtp_server = "smtp.mailtrap.io"
login = "1a2b3c4d5e6f7g" # your login generated by Mailtrap
password = "1a2b3c4d5e6f7g" # your password generated by Mailtrap

Mailtrap makes things even easier. Go to the Integrations section in the SMTP settings tab and get the ready-to-use template of the simple message, with your Mailtrap credentials in it. It is the most basic option of instructing your Python script on who sends what to who is the sendmail() instance method:

Sending Emails in Python — Tutorial with Code Examples

The code looks pretty straightforward, right? Let’s take a closer look at it and add some error handling (see the comments in between). To catch errors, we use the try and except blocks.

# The first step is always the same: import all necessary components:
import smtplib
from socket import gaierror

# Now you can play with your code. Let’s define the SMTP server separately here:
port = 2525
smtp_server = "smtp.mailtrap.io"
login = "1a2b3c4d5e6f7g" # paste your login generated by Mailtrap
password = "1a2b3c4d5e6f7g" # paste your password generated by Mailtrap

# Specify the sender’s and receiver’s email addresses:
sender = "from@example.com"
receiver = "mailtrap@example.com"

# Type your message: use two newlines (\n) to separate the subject from the message body, and use 'f' to  automatically insert variables in the text
message = f"""\
Subject: Hi Mailtrap
To: {receiver}
From: {sender}
This is my first message with Python."""

try:
  # Send your message with credentials specified above
  with smtplib.SMTP(smtp_server, port) as server:
    server.login(login, password)
    server.sendmail(sender, receiver, message)
except (gaierror, ConnectionRefusedError):
  # tell the script to report if your message was sent or which errors need to be fixed
  print('Failed to connect to the server. Bad connection settings?')
except smtplib.SMTPServerDisconnected:
  print('Failed to connect to the server. Wrong user/password?')
except smtplib.SMTPException as e:
  print('SMTP error occurred: ' + str(e))
else:
  print('Sent')

Once you get the Sent result in Shell, you should see your message in your Mailtrap inbox:

Sending Emails in Python — Tutorial with Code Examples

Sending emails with HTML content

In most cases, you need to add some formatting, links, or images to your email notifications. We can simply put all of these with the HTML content. For this purpose, Python has an email package.

We will deal with the MIME message type, which is able to combine HTML and plain text. In Python, it is handled by the email.mime module.

It is better to write a text version and an HTML version separately, and then merge them with the MIMEMultipart("alternative") instance. It means that such a message has two rendering options accordingly. In case an HTML isn’t be rendered successfully for some reason, a text version will still be available.

import smtplib
from email.mime.text import MIMEText
from email.mime.multipart import MIMEMultipart

port = 2525
smtp_server = "smtp.mailtrap.io"
login = "1a2b3c4d5e6f7g" # paste your login generated by Mailtrap
password = "1a2b3c4d5e6f7g" # paste your password generated by Mailtrap

sender_email = "mailtrap@example.com"
receiver_email = "new@example.com"

message = MIMEMultipart("alternative")
message["Subject"] = "multipart test"
message["From"] = sender_email
message["To"] = receiver_email
# Write the plain text part
text = """\ Hi, Check out the new post on the Mailtrap blog: SMTP Server for Testing: Cloud-based or Local? https://blog.mailtrap.io/2018/09/27/cloud-or-local-smtp-server/ Feel free to let us know what content would be useful for you!"""

# write the HTML part
html = """\ <html> <body> <p>Hi,<br> Check out the new post on the Mailtrap blog:</p> <p><a href="https://blog.mailtrap.io/2018/09/27/cloud-or-local-smtp-server">SMTP Server for Testing: Cloud-based or Local?</a></p> <p> Feel free to <strong>let us</strong> know what content would be useful for you!</p> </body> </html> """

# convert both parts to MIMEText objects and add them to the MIMEMultipart message
part1 = MIMEText(text, "plain")
part2 = MIMEText(html, "html")
message.attach(part1)
message.attach(part2)

# send your email
with smtplib.SMTP("smtp.mailtrap.io", 2525) as server:
  server.login(login, password)
  server.sendmail( sender_email, receiver_email, message.as_string() )

print('Sent')
Sending Emails in Python — Tutorial with Code ExamplesThe resulting output

Sending Emails with Attachments in Python

The next step in mastering sending emails with Python is attaching files. Attachments are still the MIME objects but we need to encode them with the base64 module. A couple of important points about the attachments:

  1. Python lets you attach text files, images, audio files, and even applications. You just need to use the appropriate email class like email.mime.audio.MIMEAudioor email.mime.image.MIMEImage. For the full information, refer to this section of the Python documentation.
  2. Remember about the file size: sending files over 20MB is a bad practice.

In transactional emails, the PDF files are the most frequently used: we usually get receipts, tickets, boarding passes, order confirmations, etc. So let’s review how to send a boarding pass as a PDF file.

import smtplib
from email import encoders
from email.mime.base import MIMEBase
from email.mime.multipart import MIMEMultipart
from email.mime.text import MIMEText

port = 2525
smtp_server = "smtp.mailtrap.io"
login = "1a2b3c4d5e6f7g" # paste your login generated by Mailtrap
password = "1a2b3c4d5e6f7g" # paste your password generated by Mailtrap

subject = "An example of boarding pass"
sender_email = "mailtrap@example.com"
receiver_email = "new@example.com"

message = MIMEMultipart()
message["From"] = sender_email
message["To"] = receiver_email
message["Subject"] = subject

# Add body to email
body = "This is an example of how you can send a boarding pass in attachment with Python"
message.attach(MIMEText(body, "plain"))

filename = "yourBP.pdf"
# Open PDF file in binary mode
# We assume that the file is in the directory where you run your Python script from
with open(filename, "rb") as attachment:
# The content type "application/octet-stream" means that a MIME attachment is a binary file
part = MIMEBase("application", "octet-stream")
part.set_payload(attachment.read())
# Encode to base64
encoders.encode_base64(part)
# Add header
part.add_header("Content-Disposition", f"attachment; filename= {filename}")
# Add attachment to your message and convert it to string
message.attach(part)

text = message.as_string()
# send your email
with smtplib.SMTP("smtp.mailtrap.io", 2525) as server:
  server.login(login, password)
  server.sendmail(sender_email, receiver_email, text)

print('Sent')
Sending Emails in Python — Tutorial with Code ExamplesThe received email with your PDF

To attach several files, you can call the message.attach() method several times.

How to send an email with image attachment

Images, even if they are a part of the message body, are attachments as well. There are three types of them: CID attachments (embedded as a MIME object), base64 images (inline embedding), and linked images.

For adding a CID attachment, we will create a MIME multipart message with MIMEImage component:

import smtplib
from email.mime.text import MIMEText
from email.mime.image import MIMEImage
from email.mime.multipart import MIMEMultipart

port = 2525
smtp_server = "smtp.mailtrap.io"
login = "1a2b3c4d5e6f7g" # paste your login generated by Mailtrap
password = "1a2b3c4d5e6f7g" # paste your password generated by Mailtrap

sender_email = "mailtrap@example.com"
receiver_email = "new@example.com"

message = MIMEMultipart("alternative")
message["Subject"] = "CID image test"
message["From"] = sender_email
message["To"] = receiver_email

# write the HTML part
html = """\
<html>
<body>
<img src="cid:myimage">
</body>
</html>
"""
part = MIMEText(html, "html")
message.attach(part)

# We assume that the image file is in the same directory that you run your Python script from
with open('mailtrap.jpg', 'rb') as img:
  image = MIMEImage(img.read())
# Specify the  ID according to the img src in the HTML part
image.add_header('Content-ID', '<myimage>')
message.attach(image)

# send your email
with smtplib.SMTP("smtp.mailtrap.io", 2525) as server:
  server.login(login, password)
  server.sendmail(sender_email, receiver_email, message.as_string())

print('Sent')
Sending Emails in Python — Tutorial with Code ExamplesThe received email with CID image

The CID image is shown both as a part of the HTML message and as an attachment. Messages with this image type are often considered spam: check the Analytics tab in Mailtrap to see the spam rate and recommendations on its improvement. Many email clients — Gmail in particular — don’t display CID images in most cases. So let’s review how to embed a base64 encoded image instead.

Here we will use base64 module and experiment with the same image file:

import smtplib
from email.mime.text import MIMEText
from email.mime.multipart import MIMEMultipart
import base64

port = 2525
smtp_server = "smtp.mailtrap.io"
login = "1a2b3c4d5e6f7g" # paste your login generated by Mailtrap
password = "1a2b3c4d5e6f7g" # paste your password generated by Mailtrap
sender_email = "mailtrap@example.com"
receiver_email = "new@example.com"

message = MIMEMultipart("alternative")
message["Subject"] = "inline embedding"
message["From"] = sender_email
message["To"] = receiver_email

# We assume that the image file is in the same directory that you run your Python script from
with open("image.jpg", "rb") as image:
  encoded = base64.b64encode(image.read()).decode()

html = f"""\
<html>
<body>
<img src="data:image/jpg;base64,{encoded}">
</body>
</html>
"""
part = MIMEText(html, "html")
message.attach(part)

# send your email
with smtplib.SMTP("smtp.mailtrap.io", 2525) as server:
  server.login(login, password)
  server.sendmail(sender_email, receiver_email, message.as_string())

print('Sent')
Sending Emails in Python — Tutorial with Code ExamplesA base64 encoded image

Now the image is embedded into the HTML message and is not available as an attached file. Python has encoded our JPEG image, and if we go to the HTML Source tab, we will see the long image data string in the img src attribute.

How to Send Multiple Emails

Sending multiple emails to different recipients and making them personal is the special thing about emails in Python.

To add several more recipients, you can just type their addresses in separated by a comma, add Cc and Bcc. But if you work with a bulk email sending, Python will save you with loops.

One of the options is to create a database in a CSVformat (we assume it is saved to the same folder as your Python script).

We often see our names in transactional or even promotional examples. Here is how we can make it with Python.

Let’s organize the list in a simple table with just two columns: name and email address. It should look like the following example:

#name,email
John Johnson,john@johnson.com
Peter Peterson,peter@peterson.com

The code below will open the file and loop over its rows line by line, replacing the {name} with the value from the “name” column.

import csv
import smtplib

port = 2525
smtp_server = "smtp.mailtrap.io"
login = "1a2b3c4d5e6f7g" # paste your login generated by Mailtrap
password = "1a2b3c4d5e6f7g" # paste your password generated by Mailtrap

message = """Subject: Order confirmation
To: {recipient}
From: {sender}
Hi {name}, thanks for your order! We are processing it now and will contact you soon"""
sender = "new@example.com"
with smtplib.SMTP("smtp.mailtrap.io", 2525) as server:
  server.login(login, password)
  with open("contacts.csv") as file:
  reader = csv.reader(file)
  next(reader)  # it skips the header row
  for name, email in reader:
    server.sendmail(
      sender,
      email,
      message.format(name=name, recipient=email, sender=sender),
    )
    print(f'Sent to {name}')

In our Mailtrap inbox, we see two messages: one for John Johnson and another for Peter Peterson, delivered simultaneously:

Sending Emails in Python — Tutorial with Code Examples


Sending emails with Python via Gmail

When you are ready for sending emails to real recipients, you can configure your production server. It also depends on your needs, goals, and preferences: your localhost or any external SMTP.

One of the most popular options is Gmail so let’s take a closer look at it.

We can often see titles like “How to set up a Gmail account for development”. In fact, it means that you will create a new Gmail account and will use it for a particular purpose.

To be able to send emails via your Gmail account, you need to provide access to it for your application. You can Allow less secure apps or take advantage of the OAuth2 authorization protocol. It’s a way more difficult but recommended due to the security reasons.

Further, to use a Gmail server, you need to know:

  • the server name = smtp.gmail.com
  • port = 465 for SSL/TLS connection (preferred)
  • or port = 587 for STARTTLS connection
  • username = your Gmail email address
  • password = your password
import smtplib
import ssl

port = 465
password = input("your password")
context = ssl.create_default_context()

with smtplib.SMTP_SSL("smtp.gmail.com", port, context=context) as server:
  server.login("my@gmail.com", password)

If you tend to simplicity, then you can use Yagmail, the dedicated Gmail/SMTP. It makes email sending really easy. Just compare the above examples with these several lines of code:

import yagmail

yag = yagmail.SMTP()
contents = [
"This is the body, and here is just text http://somedomain/image.png",
"You can find an audio file attached.", '/local/path/to/song.mp3'
]
yag.send('to@someone.com', 'subject', contents)

Next steps with Python

Those are just basic options of sending emails with Python. To get great results, review the Python documentation and experiment with your own code!

There are a bunch of various Python frameworks and libraries, which make creating apps more elegant and dedicated. In particular, some of them can help improve your experience with building emails sending functionality:

The most popular frameworks are:

  1. Flask, which offers a simple interface for email sending: Flask Mail.
  2. Django, which can be a great option for building HTML templates.
  3. Zope comes in handy for a website development.
  4. Marrow Mailer is a dedicated mail delivery framework adding various helpful configurations.
  5. Plotly and its Dash can help with mailing graphs and reports.

Also, here is a handy list of Python resources sorted by their functionality.

Good luck and don’t forget to stay on the safe side when sending your emails!

This article was originally published at Mailtrap’s blog: Sending emails with Python

Viewing all 22859 articles
Browse latest View live


<script src="https://jsc.adskeeper.com/r/s/rssing.com.1596347.js" async> </script>