Quantcast
Channel: Planet Python
Viewing all 22859 articles
Browse latest View live

Continuum Analytics Blog: Anaconda Enters a New Chapter

$
0
0

Today I am excited to announce that I am stepping into the role of CEO at Anaconda. Although I am a founder of the company and have previously served as president, this marks the first…

The post Anaconda Enters a New Chapter appeared first on Anaconda.


PyCon: Financial Aid Launches for PyCon US 2020!

$
0
0
PyCon US 2020 is opening applications for Financial Aid today, and we’ll be accepting them through January 31, 2020.

To apply, first set up an account on the site, and then you will be able to fill out the application through your dashboard.

The financial aid program aims to bring many folks to PyCon by limiting the maximum grant amount per person; in that way, we can offer support to more people based on individual need. The financial aid program reimburses direct travel costs including transportation, hotel, and childcare, as well as offering discounted or waived registration tickets. For complete details, see our FAQ, and contact pycon-aid@python.org with further questions.

The Python Software Foundation& PyLadies make Financial Aid possible. This year, the Python Software Foundation is contributing $130,000 USD towards financial aid and PyLadies will contribute as much as they can based on the contributions they get throughout 2019.

For more information about go to the Financial Aid page on the conference website.

Call for Proposals is also open!

Tutorial proposals are due November 22, 2019, while talk, poster, and education summit proposals are due December 20, 2019. For more information, see details here.

For those proposing talks, tutorials, or posters, selecting the “I require a speaker grant if my proposal is accepted” box on your speaker profile serves as your request, you do not need to fill out the financial aid application. Upon acceptance of the proposal, we’ll contact the speakers who checked that box to gather the appropriate information. Accepted speakers and presenters are prioritized for travel grants. Additionally, we do not expose grant requests to reviewers while evaluating proposals. The Program Committee evaluates proposals on the basis of their presentation, and later the Financial Aid team comes in and looks at how we can help our speakers.

Real Python: Emacs: The Best Python Editor?

$
0
0

Finding the right code editor for Python development can be tricky. Many developers explore numerous editors as they grow and learn. To choose the right code editor, you have to start by knowing which features are important to you. Then, you can try to find editors that have those features. One of the most feature-rich editors available is Emacs.

Emacs started in the mid-1970s as a set of macro extensions for a different code editor. It was adopted into the GNU project by Richard Stallman in the early 1980s, and GNU Emacs has been continuously maintained and developed ever since. To this day, GNU Emacs and the XEmacs variant are available on every major platform, and GNU Emacs continues to be a combatant in the Editor Wars.

In this tutorial, you’ll learn about using Emacs for Python development, including how to:

  • Install Emacs on your selected platform
  • Set up an Emacs initialization file to configure Emacs
  • Build a basic Python configuration for Emacs
  • Write Python code to explore Emacs capabilities
  • Run and Test Python code in the Emacs environment
  • Debug Python code using integrated Emacs tools
  • Add source control functionality using Git

For this tutorial, you’ll use GNU Emacs 25 or later, although most of the techniques shown will work on older versions (and XEmacs) as well. You should have some experience developing in Python, and your machine should have a Python distribution already installed and ready to go.

Updates:

  • 10/09/2019: Major update adding new code samples, updated package availability and info, basic tutorial, Jupyter walk-through, debugging walk-through, testing walk-through, and updated visuals.
  • 11/03/2015: Initial tutorial published.

You can download all the files referenced in this tutorial at the link below:

Download Code:Click here to download the code you'll use to learn about Emacs for Python in this tutorial.

Installation and Basics

Before you can explore Emacs and all it has to offer a Python developer, you need to install it and learn some of the basics.

Installation

When you install Emacs, you have to consider your platform. This guide, provided by ErgoEmacs, provides everything you need to get up and running with a basic Emacs installation on Linux, Mac, or Windows.

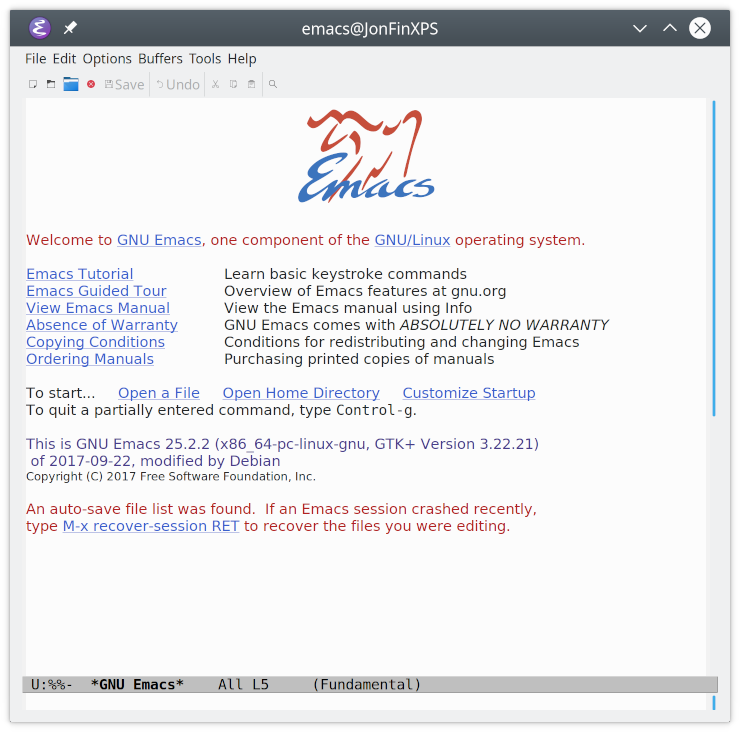
Once the installation has finished, you can start Emacs:

Emacs when it first runs

You should be greeted with the default startup screen.

Basic Emacs

First, let’s go through a quick example to cover some basic Emacs for Python development. You’ll see how to edit a program using vanilla Emacs, and how much Python support is built into the program. With Emacs open, use the following steps to create a quick Python program:

  1. Hit Ctrl+XCtrl+F to open a new file.
  2. Type sieve.py to name the file.
  3. Hit Enter.
  4. Emacs may ask you to confirm your choice. If so, then hit Enter again.

Now type the following code:

 1 MAX_PRIME=100 2  3 sieve=[True]*MAX_PRIME 4 foriinrange(2,MAX_PRIME): 5 ifsieve[i]: 6 print(i) 7 forjinrange(i*i,MAX_PRIME,i): 8 sieve[j]=False

You may recognize this code as the Sieve of Eratosthenes, which finds all primes below a given maximum. As you type the code, you’ll notice:

  • Emacs highlights variables and constants differently from Python keywords.
  • Emacs indents lines following for and if statements automatically.
  • Emacs changes the indentation to appropriate locations when you hit Tab on an indented line.
  • Emacs highlights the opening bracket or parenthesis whenever you type a closing bracket or parenthesis.
  • Emacs responds as expected to the arrow keys, as well as the Enter, Backspace, Del, Home, End, and Tab keys.

There are some odd key mappings in Emacs, however. If you try to paste code into Emacs, for instance, then you may find the standard Ctrl+V keystroke doesn’t work.

The easiest way to learn which keys do what in Emacs is to follow the built-in tutorial. You can access it by positioning the cursor over the words Emacs Tutorial on the Emacs start screen and pressing Enter, or by typing Ctrl+HT at any time thereafter. You’ll be greeted with the following passage:

Emacs commands generally involve the CONTROL key (sometimes labeled
CTRL or CTL) or the META key (sometimes labeled EDIT or ALT).  Rather than
write that in full each time, we'll use the following abbreviations:

 C-<chr>  means hold the CONTROL key while typing the character <chr>
          Thus, C-f would be: hold the CONTROL key and type f.
 M-<chr>  means hold the META or EDIT or ALT key down while typing <chr>.
          If there is no META, EDIT or ALT key, instead press and release the
          ESC key and then type <chr>.  We write <ESC> for the ESC key.

Important Note: to end the Emacs session, type C-x C-c.  (Two characters.)
To quit a partially entered command, type C-g.

When you scan the text from the passage, you’ll see that Emacs keystrokes are shown in the Emacs documentation using the notation C-x C-s. This is the command to save the contents of the current buffer. This notation indicates that the Ctrl and X keys are pressed at the same time, followed by the Ctrl and S keys.

Note: In this tutorial, Emacs keystrokes are shown as Ctrl+XCtrl+S.

Emacs uses some terminology that can be traced back to its text-based UNIX roots. Since these terms have different meanings now, it’s a good idea to review them, as you’ll be reading about them as the tutorial progresses:

  • The window you see when you start Emacs is referred to as a frame. You can open as many Emacs frames as you wish, on as many monitors as you wish, and Emacs will track them all.

  • The panes within each Emacs frame are referred to as windows. Emacs frames initially contain a single window, but you can open multiple windows in each frame, either manually or by running special commands.

  • Within each window, the contents displayed are called a buffer. Buffers can contain the contents of files, the output of commands, the lists of menu options, or other items. Buffers are where you interact with Emacs.

  • When Emacs needs your input, it asks in a special one-line area at the bottom of the currently active frame called the mini-buffer. If you ever find yourself there unexpectedly, then you can cancel whatever got you there with Ctrl+G.

Now that you’ve covered the basics, it’s time to start customizing and configuring Emacs for Python development!

Initialization File

One of the great benefits of Emacs is its powerful configuration options. The core of Emacs configuration is the initialization file, which is processed every time Emacs is started.

This file contains commands written in Emacs Lisp, which is executed every time Emacs is started. Don’t worry, though! You don’t need to know Lisp to use or customize Emacs. In this tutorial, you’ll find everything you need to get started. (After all, this is Real Python, not Real Lisp!)

On start-up, Emacs looks for the initialization file in three places:

  1. First, it looks in your home user folder for the file .emacs.
  2. If it’s not there, then Emacs looks in your home user folder for the file emacs.el.
  3. Finally, if neither is found, then it looks in your home folder for .emacs.d/init.el.

The last option, .emacs.d/init.el, is the current recommended initialization file. However, if you’ve previously used and configured Emacs, then you may already have one of the other initialization files present. If so, then continue to use that file as you read this tutorial.

When you first install Emacs, there is no .emacs.d/init.el, but you can create this file fairly quickly. With the Emacs window open, follow these steps:

  1. Hit Ctrl+XCtrl+F.
  2. Type ~/.emacs.d/init.el in the mini-buffer.
  3. Hit Enter.
  4. Emacs may ask you to confirm your choice. If so, then hit Enter again.

Let’s take a closer look at what’s happening here:

  • You tell Emacs that you want to find and open a file with the keystrokes Ctrl+XCtrl+F.

  • You tell Emacs what file to open by giving it a path to the file. The path ~/.emacs.d/init.el has three parts:

    1. The leading tilde ~ is a shortcut to your home folder. On Linux and Mac machines, this is usually /home/<username>. On Windows machines, it’s the path specified in the HOME environment variable.
    2. The folder .emacs.d is where Emacs stores all its configuration information. You can use this folder to quickly set up Emacs on a new machine. To do so, copy the contents of this folder to your new machine, and Emacs is good to go!
    3. The file init.el is your initialization file.
  • You tell Emacs, “Yes, I do want to create this new file.” (This step is required since the file doesn’t exist. Normally, Emacs will simply open the file specified.)

After Emacs creates the new file, it opens that file in a new buffer for you to edit. This action doesn’t actually create the file yet, though. You must save the blank file using Ctrl+XCtrl+S to create it on disk.

Throughout this tutorial, you’ll see initialization code snippets that enable different features. Create the initialization file now if you want to follow along! You can also find the complete initialization file at the link below:

Download Code:Click here to download the code you'll use to learn about Emacs for Python in this tutorial.

Customization Packages

Now that you have an initialization file, you can add customization options to tailor Emacs for Python development. There are a few ways you can customize Emacs, but the one with the fewest steps is adding Emacs packages. These come from a variety of sources, but the primary package repository is MELPA, or the Milkypostman’s Emacs Lisp Package Archive.

Think of MELPA as PyPI for Emacs packages. Everything you need and will use in this tutorial can be found there. To begin using it, expand the code block below and copy the configuration code to your init.el file:

 1 ;; .emacs.d/init.el 2  3 ;; =================================== 4 ;; MELPA Package Support 5 ;; =================================== 6 ;; Enables basic packaging support 7 (require'package) 8  9 ;; Adds the Melpa archive to the list of available repositories10 (add-to-list'package-archives11 '("melpa"."http://melpa.org/packages/")t)12 13 ;; Initializes the package infrastructure14 (package-initialize)15 16 ;; If there are no archived package contents, refresh them17 (when(notpackage-archive-contents)18 (package-refresh-contents))19 20 ;; Installs packages21 ;;22 ;; myPackages contains a list of package names23 (defvarmyPackages24 '(better-defaults;; Set up some better Emacs defaults25 material-theme;; Theme26 )27 )28 29 ;; Scans the list in myPackages30 ;; If the package listed is not already installed, install it31 (mapc#'(lambda(package)32 (unless(package-installed-ppackage)33 (package-installpackage)))34 myPackages)35 36 ;; ===================================37 ;; Basic Customization38 ;; ===================================39 40 (setqinhibit-startup-messaget);; Hide the startup message41 (load-theme'materialt);; Load material theme42 (global-linum-modet);; Enable line numbers globally43 44 ;; User-Defined init.el ends here

As you read through the code, you’ll see that init.el is broken into sections. Each section is separated by comment blocks that begin with two semicolons (;;). The first section is titled MELPA Package Support:

 1 ;; .emacs.d/init.el 2  3 ;; =================================== 4 ;; MELPA Package Support 5 ;; =================================== 6 ;; Enables basic packaging support 7 (require'package) 8  9 ;; Adds the Melpa archive to the list of available repositories10 (add-to-list'package-archives11 '("melpa"."http://melpa.org/packages/")t)12 13 ;; Initializes the package infrastructure14 (package-initialize)15 16 ;; If there are no archived package contents, refresh them17 (when(notpackage-archive-contents)18 (package-refresh-contents))

This section begins by setting up the packaging infrastructure:

  • Line 7 tells Emacs to use packages.
  • Lines 10 and 11 add the MELPA archive to the list of package sources.
  • Line 14 initializes the packaging system.
  • Lines 17 and 18 build the current package content list if it doesn’t already exist.

The first section continues from line 20:

20 ;; Installs packages21 ;;22 ;; myPackages contains a list of package names23 (defvarmyPackages24 '(better-defaults;; Set up some better Emacs defaults25 material-theme;; Theme26 )27 )28 29 ;; Scans the list in myPackages30 ;; If the package listed is not already installed, install it31 (mapc#'(lambda(package)32 (unless(package-installed-ppackage)33 (package-installpackage)))34 myPackages)

At this point, you’re all set to programmatically install Emacs packages:

  • Lines 23 to 27 define a list of package names to install. You’ll add more packages as you progress through the tutorial:
    • Line 24 adds better-defaults. This is a collection of minor changes to the Emacs defaults that make it more user-friendly. It’s also a great base for further customization.
    • Line 25 adds the material-theme package, which is a nice dark style found in other environments.
  • Lines 31 to 34 traverse the list and install any packages that are not already installed.

Note: You don’t need to use the Material theme. There are many different Emacs themes available on MELPA for you to choose from. Pick one that suits your style!

After you install your packages, you can move on to the section titled Basic Customization:

36 ;; ===================================37 ;; Basic Customization38 ;; ===================================39 40 (setqinhibit-startup-messaget);; Hide the startup message41 (load-theme'materialt);; Load material theme42 (global-linum-modet);; Enable line numbers globally43 44 ;; User-Defined init.el ends here

Here, you add a few other customizations:

  • Line 40 disables the initial Emacs screen containing the tutorial information. You may want to leave this commented out by using a double semicolon (;;) until you’re more comfortable with Emacs.
  • Line 41 loads and activates the Material theme. If you want to install a different theme, then use its name here instead. You can also comment out this line to use the default Emacs theme.
  • Line 42 displays line numbers in every buffer.

Now that you have a complete basic configuration file in place, you can save the file using Ctrl+XCtrl+S. Then, close and restart Emacs to see the changes.

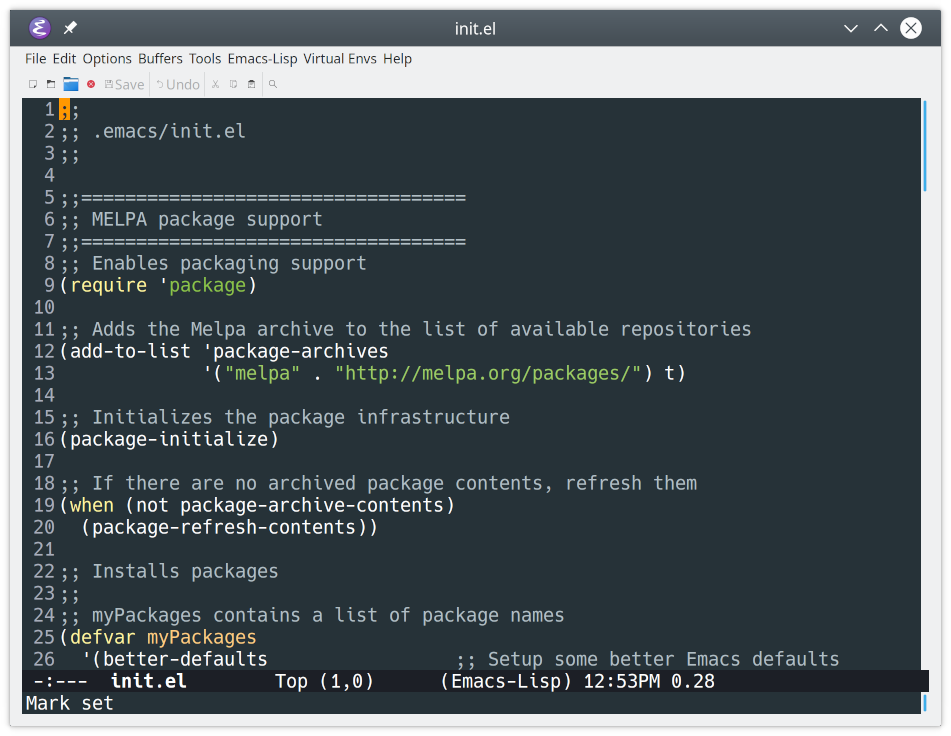
The first time Emacs runs with these options, it may take a few seconds to start as it sets up the packaging infrastructure. When that’s finished, you’ll see that your Emacs window looks a bit different:

Emacs with the Material theme applied

After the restart, Emacs skipped the initial screen and instead opened the last active file. The Material theme is applied, and line numbers have been added to the buffer.

Note: You can add packages interactively after the packaging infrastructure is set up. Hit Alt+X, then type package-show-package-list to see all the packages available to install in Emacs. As of this writing, there are over 4300 available.

With the list of packages visible, you can:

  • Quickly filter the list by package name by hitting F.
  • View the details of any package by clicking its name.
  • Install the package from the package view by clicking the Install link.
  • Close the package list using Q.

Emacs for Python Development With elpy

Emacs is ready out of the box to edit Python code. The library file python.el provides python-mode, which enables basic indentation and syntax highlighting support. However, this built-in package doesn’t provide much else. To properly compete with Python-specific IDEs (Integrated Development Environments), you’ll add more capabilities.

The elpy package (Emacs Lisp Python Environment) provides a near-complete set of Python IDE features, including:

  • Automatic indentation
  • Syntax highlighting
  • Auto completion
  • Syntax checking
  • Python REPL integration
  • Virtual environment support

To install and enable elpy, you add the package to your Emacs configuration. The following change to init.el will do the trick:

23 (defvarmyPackages24 '(better-defaults;; Set up some better Emacs defaults25 elpy;; Emacs Lisp Python Environment26 material-theme;; Theme27 )28 )

Once elpy is installed, you need to enable it. Add the following code just before the end of your init.el file:

45 ;; ====================================46 ;; Development Setup47 ;; ====================================48 ;; Enable elpy49 (elpy-enable)50 51 ;; User-Defined init.el ends here

You now have a new section titled Development Setup. Line 49 enables elpy.

Note: Unfortunately, Emacs will only read the contents of the initialization file once when it starts. If you make any changes to it, then the easiest and safest way to load them is to restart Emacs.

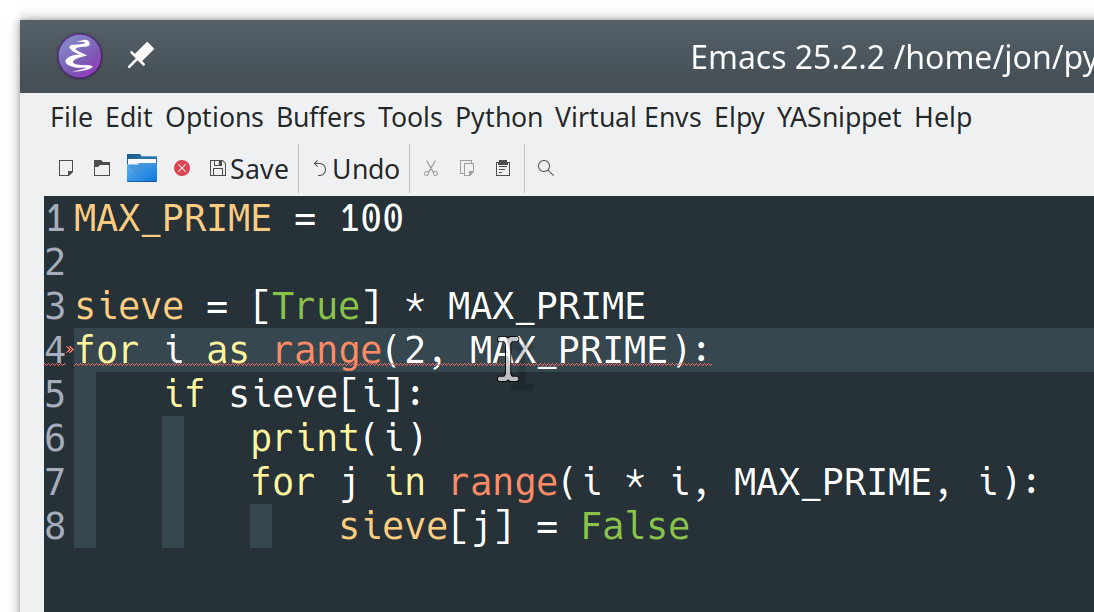
To see the new mode in action, go back to the Sieve of Eratosthenes code you entered earlier. Create a new Python file and retype the Sieve code directly:

 1 MAX_PRIME=100 2  3 sieve=[True]*MAX_PRIME 4 foriasrange(2,MAX_PRIME): 5 ifsieve[i]: 6 print(i) 7 forjinrange(i*i,MAX_PRIME,i): 8 sieve[j]=False

Note the intentional syntax error on line 4.

This is what your Python file would look like in Emacs:

elpy helping Python code writing in Emacs

Auto-indentation and keyword highlighting still work as before. However, you should also see an error indicator on line 4:

Error highlighting with elpy in Emacs

This error indicator pops up in the for loop when you typed as instead of in.

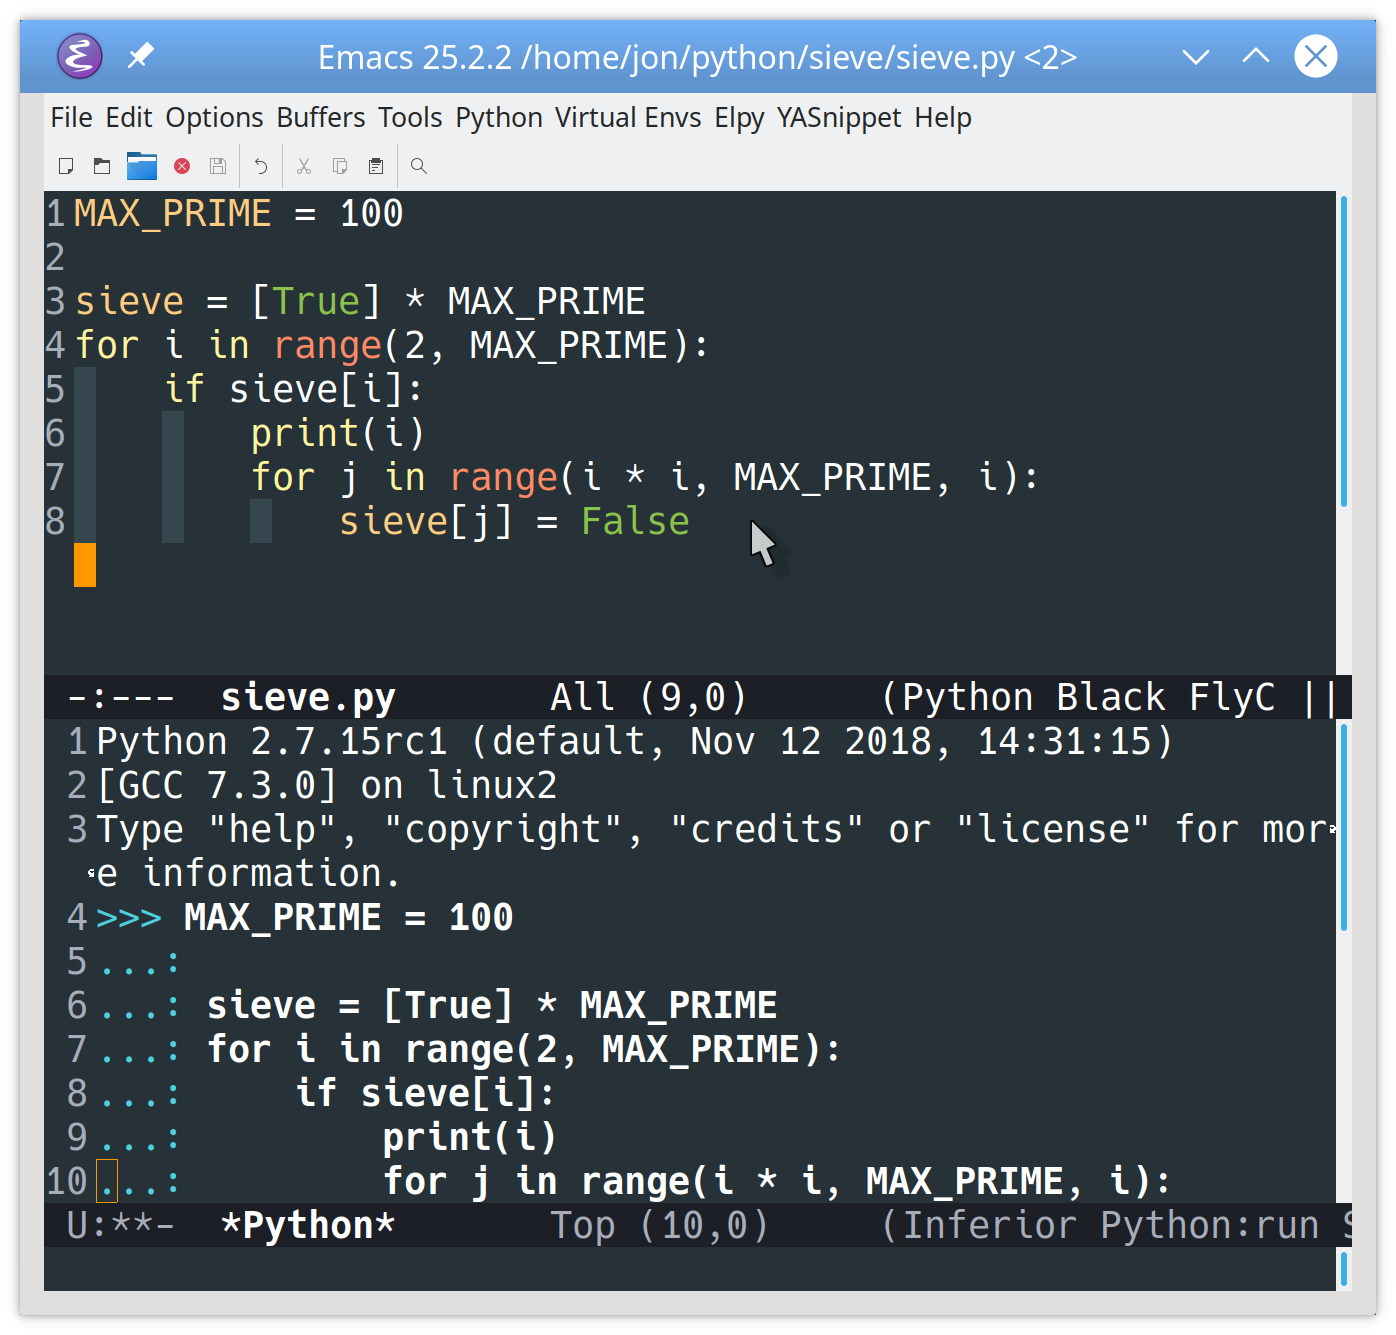
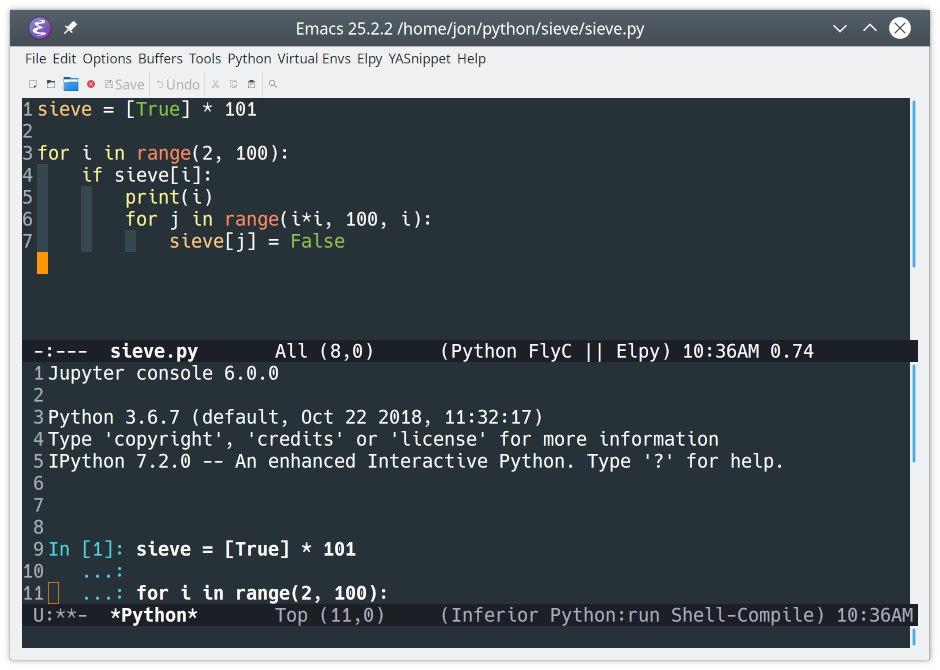
Correct that error, then type Ctrl+CCtrl+C while in the Python buffer to run the file without leaving Emacs:

Executing Python code in Emacs

When you use this command, Emacs will do the following:

  1. Create a new buffer named *Python*
  2. Open your Python interpreter and connect it to that buffer
  3. Create a new window under your current code window to display the buffer
  4. Send the code to the interpreter to execute

You can scroll through the *Python* buffer to see which interpreter was run and how the code was started. You can even type commands at the prompt (>>>) at the bottom.

Often, you’ll want to execute your code in a virtual environment using the interpreter and packages specified for that environment. Fortunately, elpy includes the pyvenv package, which provides built-in support for virtual environments.

To use an existing virtual environment in Emacs, type Alt+Xpyvenv-workon. Emacs will ask for the name of the virtual environment to use and activate it. You can deactivate the current virtual environment with Alt+Xpyvenv-deactivate. You can also access this functionality from the Emacs menu, under Virtual Envs.

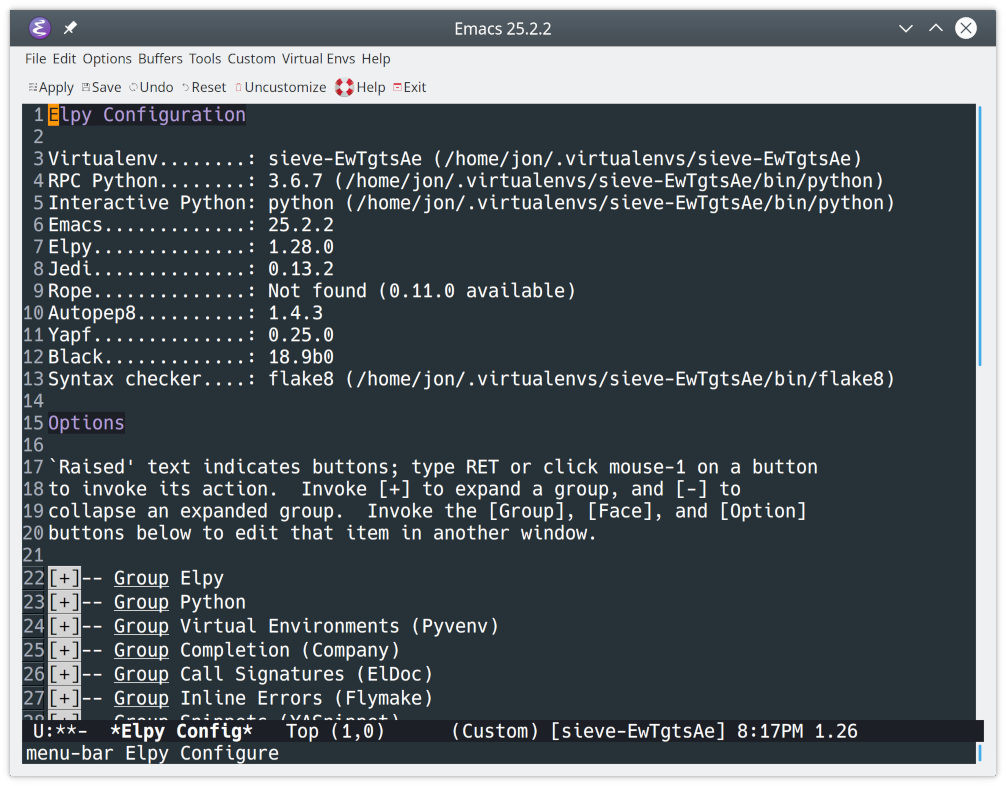
You can also configure elpy from within Emacs. Type Alt+Xelpy-config to display the following dialog:

Configuring elpy in Emacs

You should see valuable debugging information, as well as options to configure elpy.

Now you’ve put all of the basics of using Emacs with Python in place. Time to put some icing on this cake!

Additional Python Language Features

In addition to all of the basic IDE features described above, there are other syntax features you can use with Emacs for Python development. In this tutorial, you’ll cover these three:

  1. Syntax checking with flycheck
  2. Code formatting with PEP 8 and black
  3. Integration with Jupyter and IPython

This is not an exhaustive list, however! Feel free to play around with Emacs and Python to see what other syntax features you can discover.

Syntax Checking

By default, elpy uses a syntax-checking package called flymake. While flymake is built into Emacs, it only has native support four languages, and it requires significant effort to be able to support new languages.

Luckily, there is a newer and more complete solution available! The syntax-checking package flycheck supports real-time syntax checking in over 50 languages and is designed to be quickly configured for new languages. You can read about the differences between flymake and flycheck in the documentation.

You can quickly switch elpy to use flycheck instead of flymake. First, add flycheck to your init.el:

23 (defvarmyPackages24 '(better-defaults;; Set up some better Emacs defaults25 elpy;; Emacs Lisp Python Environment26 flycheck;; On the fly syntax checking27 material-theme;; Theme28 )29 )

flycheck will now be installed with the other packages.

Then, add the following lines in the Development Setup section:

46 ;; ====================================47 ;; Development Setup48 ;; ====================================49 ;; Enable elpy50 (elpy-enable)51 52 ;; Enable Flycheck53 (when(require'flychecknilt)54 (setqelpy-modules(delq'elpy-module-flymakeelpy-modules))55 (add-hook'elpy-mode-hook'flycheck-mode))

This will enable flycheck when Emacs runs your initialization file. Now you’ll see real-time syntax feedback whenever you use Emacs for Python code editing:

Flycheck syntax checking in elpy

Notice the syntax reminder for range(), which appears at the bottom of the window as you type.

Code Formatting

Love it or hate it, PEP 8 is here to stay. If you want to follow all or some of the standards, then you’ll probably want an automated way to do so. Two popular solutions are autopep8 and black. These code formatting tools must be installed in your Python environment before they can be used. To learn more about how to install an auto-formatter, check out How to Write Beautiful Python Code With PEP 8.

Once the auto-formatter is available, you can install the proper Emacs package to enable it:

You only need to install one of these in Emacs. To do so, add one of the following highlighted lines to your init.el:

23 (defvarmyPackages24 '(better-defaults;; Set up some better Emacs defaults25 elpy;; Emacs Lisp Python Environment26 flycheck;; On the fly syntax checking27 py-autopep8;; Run autopep8 on save28 blacken;; Black formatting on save29 material-theme;; Theme30 )31 )

If you’re using black, then you’re done! elpy recognizes the blacken package and will enable it automatically.

If you’re using autopep8, however, then you’ll need to enable the formatter in the Development Setup section:

48 ;; ====================================49 ;; Development Setup50 ;; ====================================51 ;; Enable elpy52 (elpy-enable)53 54 ;; Enable Flycheck55 (when(require'flychecknilt)56 (setqelpy-modules(delq'elpy-module-flymakeelpy-modules))57 (add-hook'elpy-mode-hook'flycheck-mode))58 59 ;; Enable autopep860 (require'py-autopep8)61 (add-hook'elpy-mode-hook'py-autopep8-enable-on-save)62 63 ;; User-Defined init.el ends here

Now, every time you save your Python code, the buffer is automatically formatted and saved, and the contents reloaded. You can see how this works with some badly formatted Sieve code and the black formatter:

Autopep running in Emacs

You can see that after the file is saved, it’s reloaded in the buffer with the proper black formatting applied.

Integration With Jupyter and IPython

Emacs can also work with Jupyter Notebooks and the IPython REPL. If you don’t already have Jupyter installed, then check out Jupyter Notebook: An Introduction. Once Jupyter is ready to go, add the following lines to your init.el after the call to enable elpy:

48 ;; ====================================49 ;; Development Setup50 ;; ====================================51 ;; Enable elpy52 (elpy-enable)53 54 ;; Use IPython for REPL55 (setqpython-shell-interpreter"jupyter"56 python-shell-interpreter-args"console --simple-prompt"57 python-shell-prompt-detect-failure-warningnil)58 (add-to-list'python-shell-completion-native-disabled-interpreters59 "jupyter")60 61 ;; Enable Flycheck62 (when(require'flychecknilt)63 (setqelpy-modules(delq'elpy-module-flymakeelpy-modules))64 (add-hook'elpy-mode-hook'flycheck-mode))

This will update Emacs to use IPython rather than the standard Python REPL. Now when you run your code with Ctrl+CCtrl+C, you’ll see the IPython REPL:

IPython running in Emacs

While this is pretty useful on its own, the real magic is in the Jupyter Notebook integration. As always, you need to add a bit of configuration to enable everything. The ein package enables an IPython Notebook client in Emacs. You can add it to your init.el like so:

23 (defvarmyPackages24 '(better-defaults;; Set up some better Emacs defaults25 elpy;; Emacs Lisp Python Environment26 flycheck;; On the fly syntax checking27 py-autopep8;; Run autopep8 on save28 blacken;; Black formatting on save29 ein;; Emacs IPython Notebook30 material-theme;; Theme31 )32 )

You can now start a Jupyter server and work with Notebooks from within Emacs.

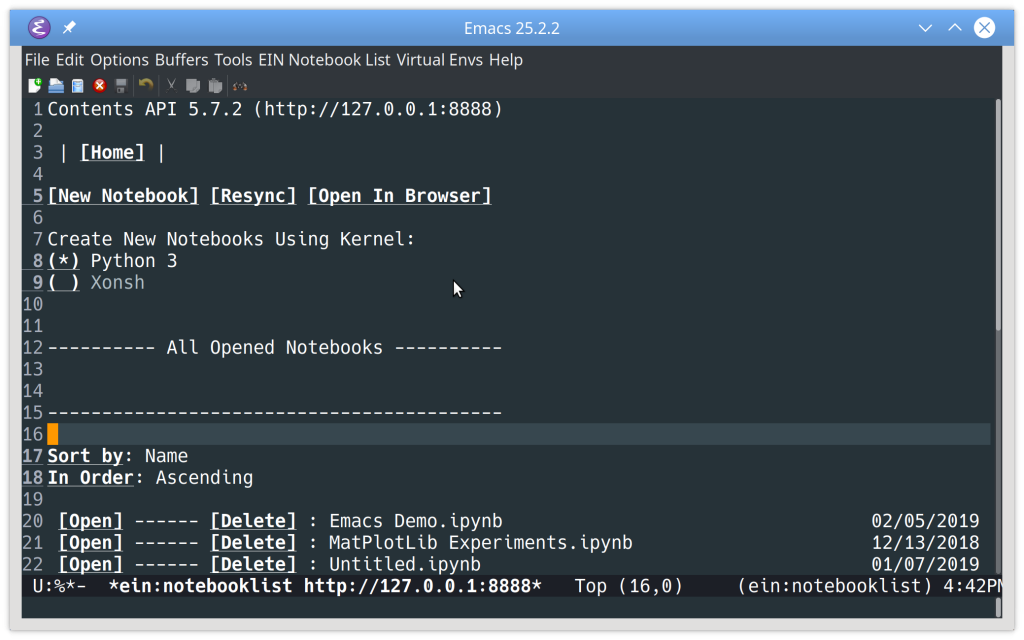
To start the server, use the command Alt+Xein:jupyter-server-start. Then provide a folder in which to run the server. You’ll see a new buffer showing the Jupyter Notebooks available in the folder selected:

List of Jupyter notebooks available in Emacs using ein

From here you can create a new Notebook with a selected kernel by clicking New Notebook, or open an existing Notebook from the list at the bottom by clicking Open:

Opening an existing Jupyter notebook in Emacs using ein

You can complete the exact same task by typing Ctrl+XCtrl+F, and then typing Ctrl+CCtrl+Z. This will open the Jupyter Notebook directly in Emacs as a file.

With a Notebook open, you can:

  • Move around the Notebook cells using the arrow keys
  • Add a new cell above the current cell using Ctrl+A
  • Add a new cell below the current cell using Ctrl+B
  • Execute new cells using either Ctrl+CCtrl+C or Alt+Enter

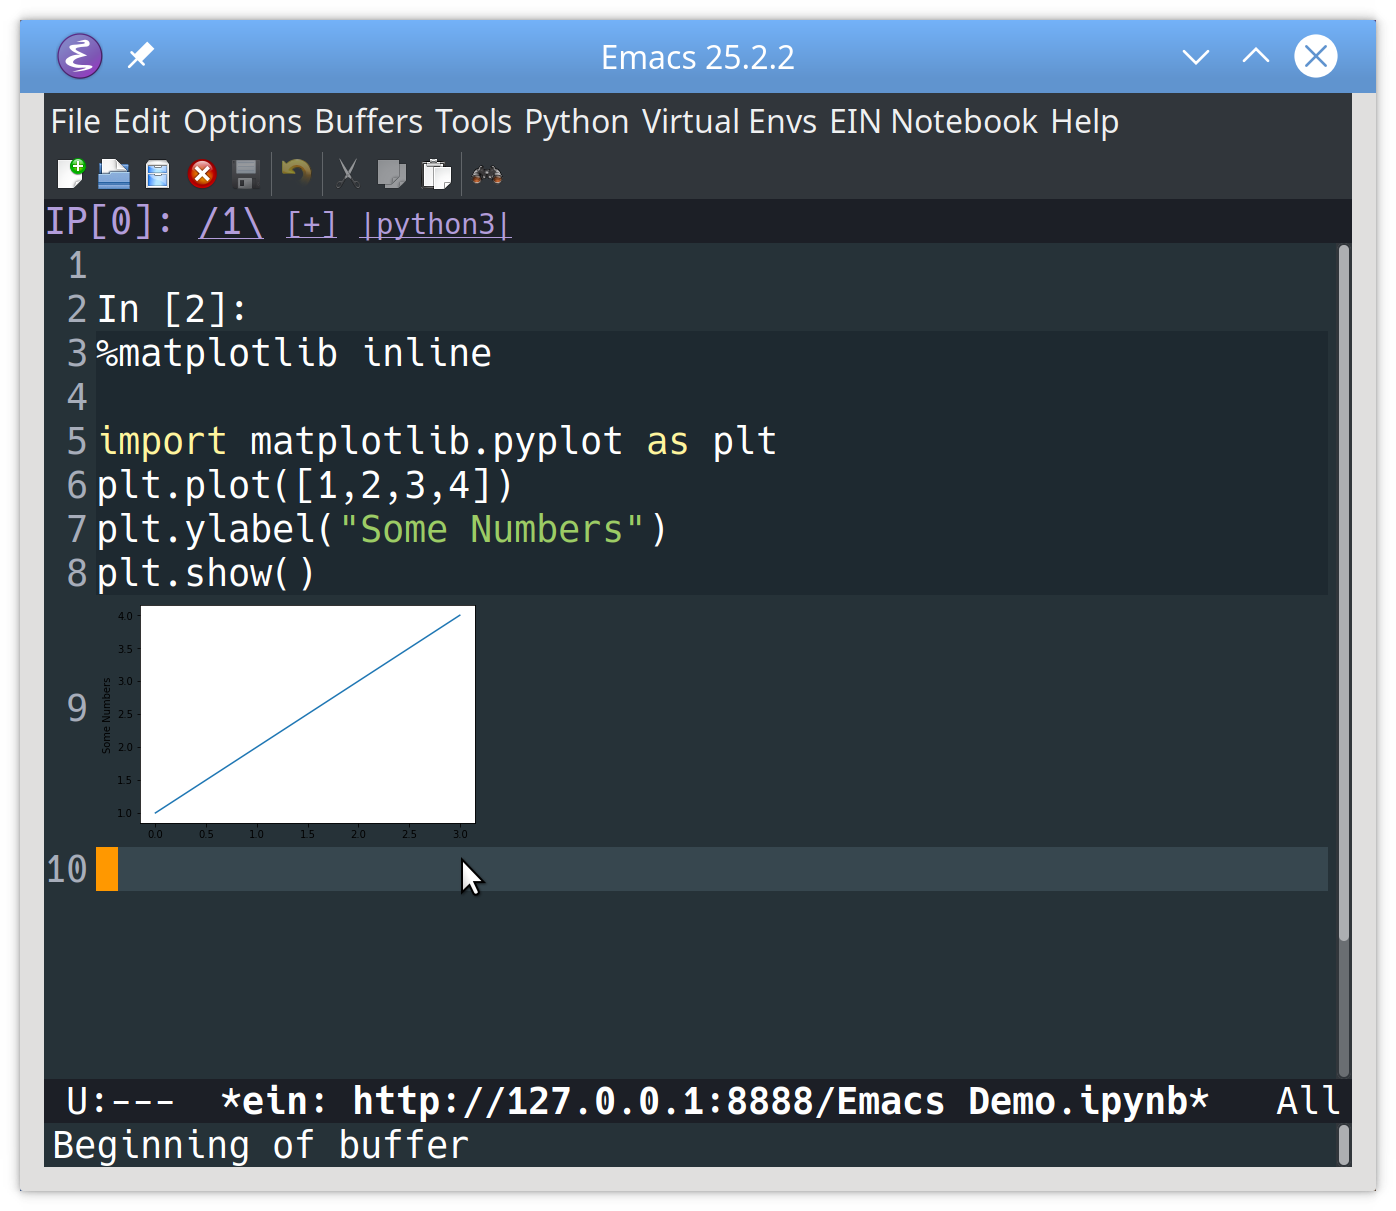
Here’s an example of how to move around a Notebook, add a new cell, and execute it:

Adding a new cell to a Jupyter notebook in Emacs using ein

You can save your work using Ctrl+XCtrl+S.

When you’re done working in your notebook, you can close it using Ctrl+CCtrl+Shift+3. You can stop the Jupyter server completely by hitting Alt+Xein:jupyter-server-stop. Emacs will ask you if you want to kill the server and close all open Notebooks.

Of course, this is just the tip of the Jupyter iceberg! You can explore everything the ein package can do in the documentation.

Testing Support

Do you write perfect code that has no side-effects and performs well under all conditions? Of course… not! If this sounds like you, though, then you’re free to skip ahead a bit. But for most developers, testing code is a requirement.

elpy provides extensive support for running tests, including support for:

To demonstrate the testing capabilities, the code for this tutorial includes a version of Edsger Dijkstra’s shunting yard algorithm. This algorithm parses mathematical equations that are written using infix notation. You can download the code at the link below:

Download Code:Click here to download the code you'll use to learn about Emacs for Python in this tutorial.

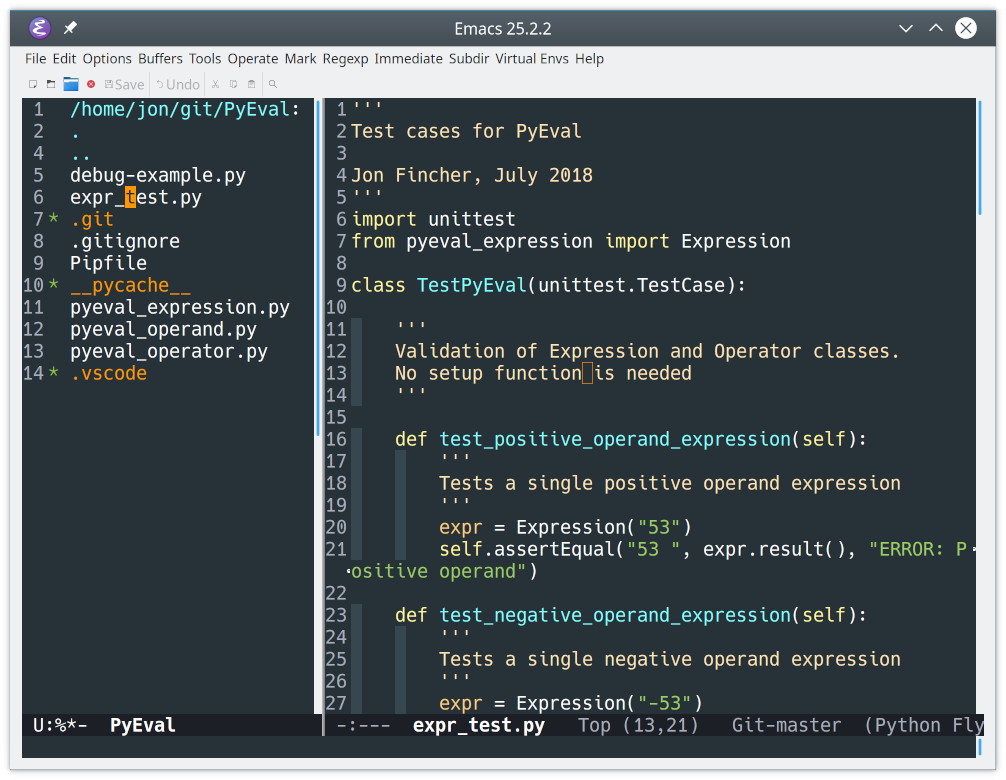
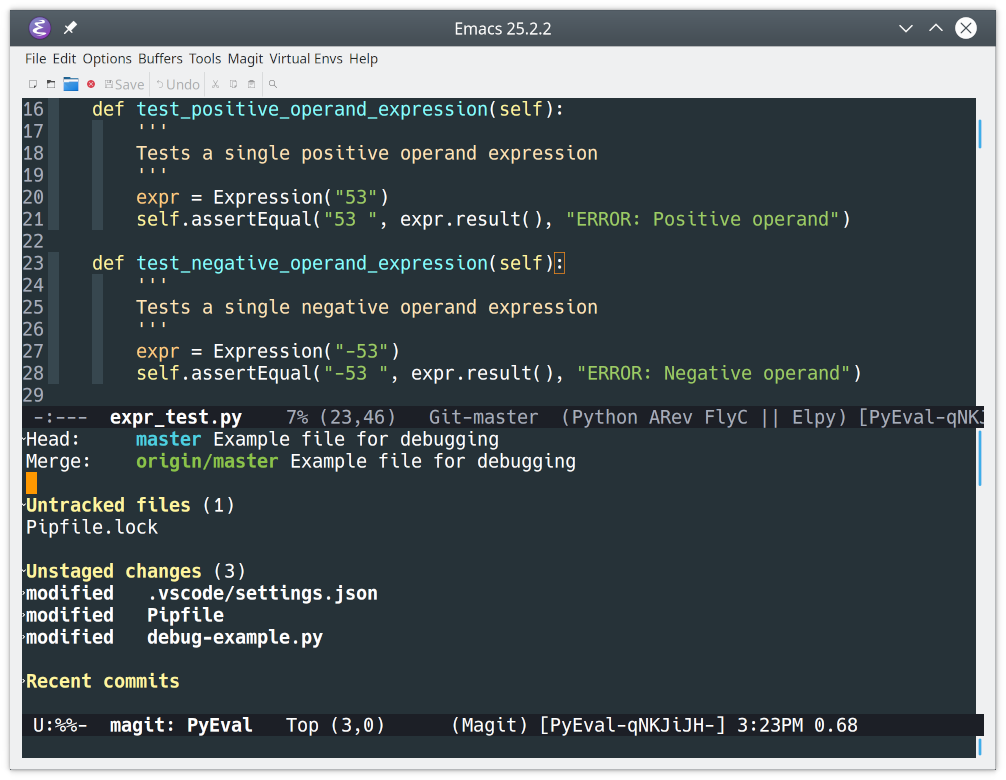
To start, let’s get a more complete picture of the project by viewing the project folder. You can open a folder in Emacs using Ctrl+XD. Next, you’ll display two windows in the same frame by splitting the frame vertically with Ctrl+X3. Finally, you navigate to the test file in the left window, and click on it to open it in the right window:

Split window view for PyEval under Emacs

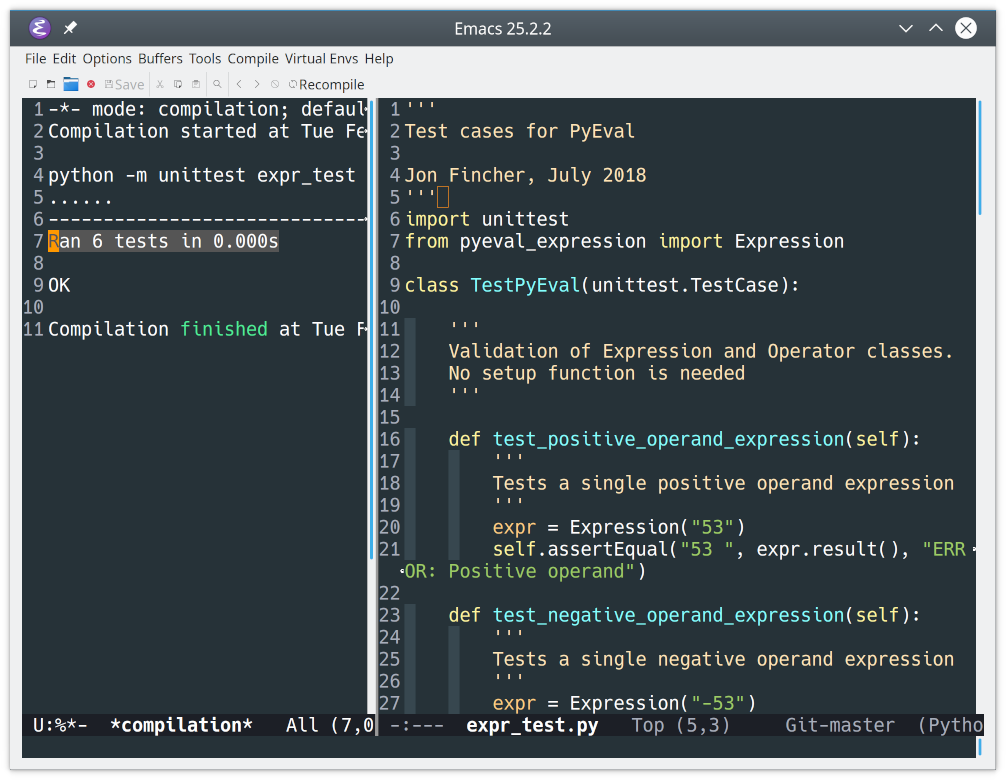
The test file expr_test.py is a basic unittest file that contains a single test case with six tests. To run the test case, type Ctrl+CCtrl+T:

Results of a Python unittest run in Emacs

The results are displayed in the left window. Notice how all six tests were run. You can run a single test in a test file by putting the cursor in that test before typing Ctrl+CCtrl+T.

Debugging Support

When tests fail, you’ll need to delve into the code to figure out why. The built-in python-mode allows you to use Emacs for Python code debugging with pdb. For an introduction to pdb, check out Python Debugging with Pdb.

Here’s how to use pdb in Emacs:

  1. Open the debug-example.py file in the PyEval project.
  2. Type Alt+Xpdb to start the Python debugger.
  3. Type debug-example.pyEnter to run the file under the debugger.

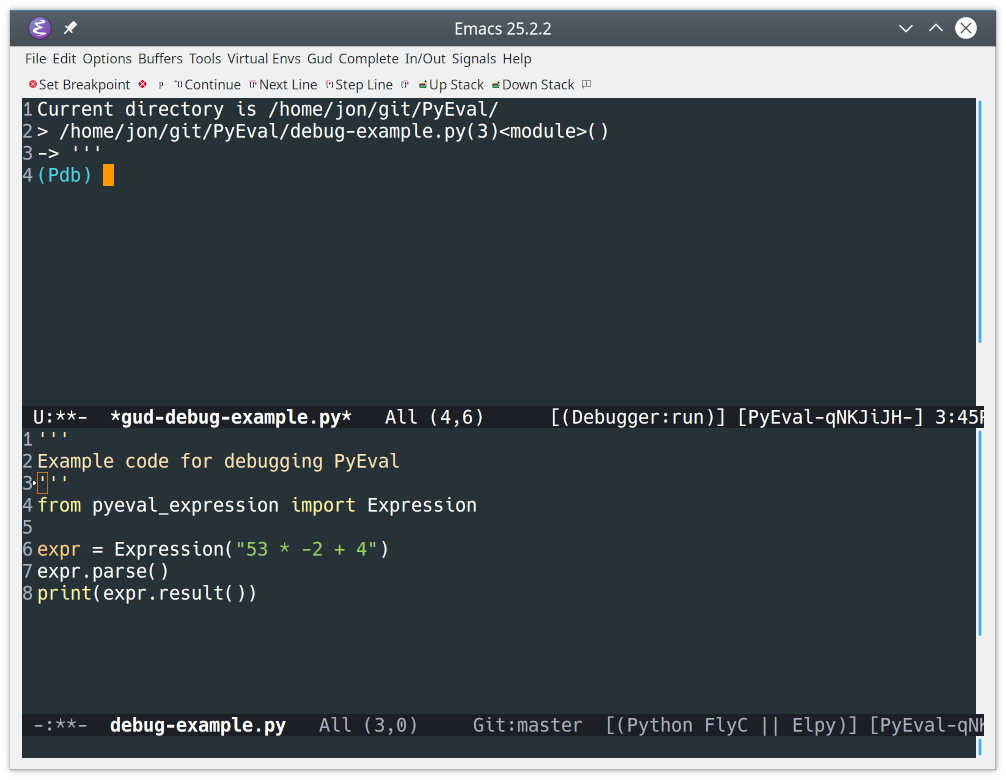
Once it’s running, pdb will split the frame horizontally and open itself in a window above the file you’re debugging:

Starting the Python debugger (pdb) in Emacs

All debuggers in Emacs run as part of the Grand Unified Debugger library, also called the GUD. This library provides a consistent interface for debugging all supported languages. The name of the buffer created, *gud-debug-example.py*, shows that the debug window was created by the GUD.

The GUD also connects pdb to the actual source file in the bottom window, which tracks your current location. Let’s step through this code to see how that works:

Stepping through Python code in Emacs

You can step through code in pdb using one of two keys:

  1. S steps into other functions.
  2. N steps over other functions.

You’ll see the cursor move in the lower source window to keep track of the execution point. As you follow function calls, pdb opens local files as required to keep you moving forward.

Git Support

No modern IDE would be complete without support for source control. While numerous source control options exist, it’s a fair bet that most programmers are using Git. If you’re not using source control, or need to learn more about Git, then check out Introduction to Git and GitHub for Python developers.

In Emacs, source control support is provided by the magit package. You install magit by listing it in your init.el file:

23 (defvarmyPackages24 '(better-defaults;; Set up some better Emacs defaults25 elpy;; Emacs Lisp Python Environment26 ein;; Emacs iPython Notebook27 flycheck;; On the fly syntax checking28 py-autopep8;; Run autopep8 on save29 blacken;; Black formatting on save30 magit;; Git integration31 material-theme;; Theme32 )33 )

After you restart Emacs, magit will be ready to use.

Let’s take a look at an example. Open any of the files in the PyEval folder, then type Alt+Xmagit-status. You’ll see the following appear:

Git repo status under Emacs

When activated, magit splits the Emacs frame and displays its status buffer in the lower window. This snapshot lists the staged, unstaged, untracked, and any other files in your repo folder.

Most of the interaction you do with magit will be in this status buffer. For example, you can:

  • Move between sections in the status buffer using P for Previous and N for Next
  • Expand or collapse a section using Tab
  • Stage changes using S
  • Unstage changes using U
  • Refresh the contents of the status buffer using G

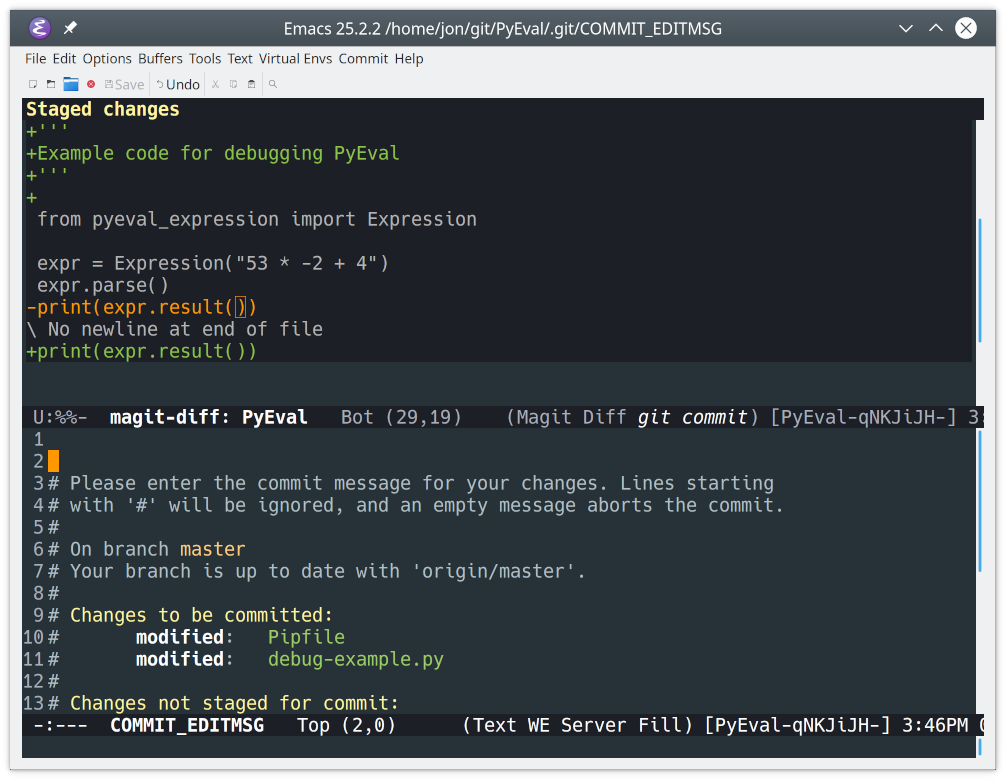
Once a change is staged, you commit it using C. You’ll be presented with a variety of commit variations. For a normal commit, hit C again. You’ll see two new buffers appear:

  1. The lower window contains the COMMIT_EDITMSG buffer, which is where you add your commit message.
  2. The upper window contains the magit-diff buffer, which displays the changes you are committing.

After entering your commit message, type Ctrl+CCtrl+C to commit the changes:

Committing staged changes to a Git repo in Emacs

You may have noticed the top of the status buffer displaying both the Head (local) and Merge (remote) branches. This allows you to push your changes to the remote branch quickly.

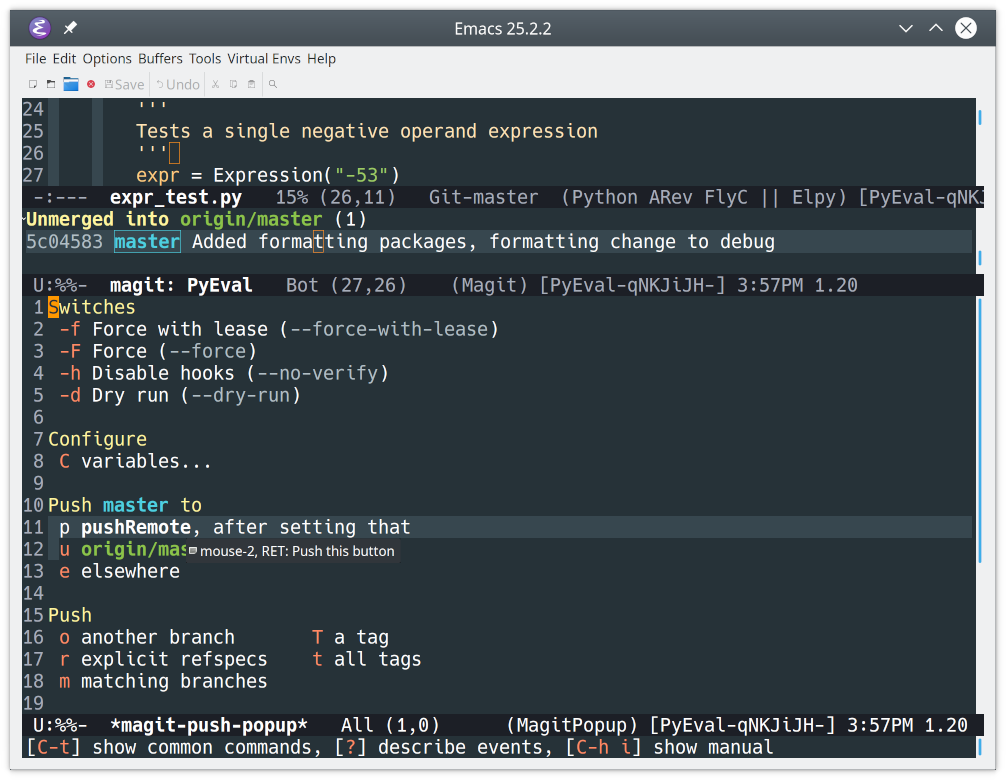
Look in the status buffer under Unmerged into origin/master and find the changes you want to push. Then, hit Shift+P to open the push options, and P to push the changes:

Pushing commits to a remote repo in Emacs

Out of the box, magit will talk to GitHub and GitLab, as well as a host of other source control tools. For more info on magit and its capabilities, check out the full documentation.

Additional Emacs Modes

One of the major benefits of using Emacs over a Python-specific IDE is the ability to work in other languages. As a developer, you might have to work with Python, Golang, JavaScript, Markdown, JSON, shell scripts, and more, all in a single day! Having complex and complete support for all of these languages in a single code editor will increase your efficiency.

There are tons of example Emacs initialization files available for you to review and use to build your own configuration. One of the best sources is GitHub. A GitHub search for emacs.d turns up a plethora of options for you to sift through.

Alternatives

Of course, Emacs is only one of several editors available for Python developers. If you’re interested in alternatives, then check out:

Conclusion

As one of the most feature-rich editors available, Emacs is great for Python programmers. Available on every major platform, Emacs is extremely customizable and adaptable to many different tasks.

Now you can:

  • Install Emacs on your selected platform
  • Set up an Emacs initialization file to configure Emacs
  • Build a basic Python configuration for Emacs
  • Write Python code to explore Emacs capabilities
  • Run and Test Python code in the Emacs environment
  • Debug Python code using integrated Emacs tools
  • Add source control functionality using Git

Give Emacs a try on your next Python project! You can download all the files referenced in this tutorial at the link below:

Download Code:Click here to download the code you'll use to learn about Emacs for Python in this tutorial.


[ Improve Your Python With 🐍 Python Tricks 💌 – Get a short & sweet Python Trick delivered to your inbox every couple of days. >> Click here to learn more and see examples ]

Wingware Blog: Python Code Warnings in Wing Pro 7

$
0
0

Wing Pro 7 introduced an improved code warnings system that flags likely errors as you work on Python code, using both Wing's built-in static analysis system and (optionally) external code checkers like Pylint, pep8, and mypy. Likely problems are indicated on the editor and listed in the CodeWarnings tool:

/images/blog/code-warnings/overview.png

Examples of warnings that Wing might flag include syntax errors, indentation problems, uses of an undefined variable, imports that cannot be resolved, or variables that are set but never used.

Code warnings save development time because they help to identify errors before code is even run. New code is checked as you work, although Wing will wait until you have finished typing so that it doesn't warn about code that is still being entered.

Navigating Warnings

Clicking on warnings in the CodeWarnings tool or pressing the Enter key in the list navigates to that warning in the editor, highlighting it briefly with a callout, as configured from the Editor>Callouts preferences group.

The warning code warnings icon appears in the top right of any editor that has some code warnings. This can be clicked in order to jump to selected warnings in the file.

When code warnings are displayed on the editor, hovering the mouse cursor over the indicator will display details for that warning in a tooltip, as shown above.

Configuration

The types of code warnings that Wing shows can be configured from the Configuration:Defaults page in the drop-down menu at the top of the CodeWarnings tool. All the warnings Wing supports are documented in Warning Types. Some of these offer configuration options to control which variants of that type of warning will be shown:

/images/blog/code-warnings/config.png

Incorporating warnings found by external checkers like Pylint, pep8, and mypy is also done from this configuration page, as described previously in Using External Code Quality Checkers with Wing Pro 7

Disabling Warnings

Since all code checkers have only a limited understanding of what happens when code is actually run, they may show incorrect warnings. Wing allows you to disable warnings either for a single case, for an entire file, or for all files.

The quickest way to disable a warning is to press the red X icon that appears in the tooltips shown in the editor or in the currently selected item in the CodeWarnings tool:

/images/blog/code-warnings/x-icon.png

Wing disables most individual warnings only for the scope it appears in, so an identical problem in another scope will still be flagged. However, undefined attribute warnings are always disabled in all files where that attribute appears.

How it Works

When a warning is disabled, Wing adds a rule to the Configuration:DisabledWarnings page in the drop-down menu at the top of the CodeWarnings tool:

/images/blog/code-warnings/disabled.png

Rules can be removed from here to reenable a warning, dragged between sections to control how widely the warning is being ignored, or edited by right-clicking in order to fine-tune the scope and nature of the rule.

For external checkers like Pylint, pep8, and mypy, warnings are disabled globally by the type of warning, making it relatively easy to develop a custom filter according to coding style and individual preference.

Resolving Imports

One thing to note here is that all the error checkers need some knowledge of your PYTHONPATH to trace down imports correctly. Often, no additional configuration is needed, but in cases where imports cannot be resolved you may need to add to the PythonPath in Wing's ProjectProperties, from the Project menu.

Sharing Code Warnings Configurations

The current code warnings configuration, including all the warnings you have disabled, may be exported to the user settings area, or to a selected file from the Options menu in the CodeWarnings tool. Projects may then share the configuration through the UseConfigurationFrom item in the CodeWarnings tool's Options menu:

/images/blog/code-warnings/options-menu.png

The shared configuration file may be checked into revision control, so it can also be used by other developers working on your project.


That's it for now! We'll be back soon with more Wing Tips for Wing Python IDE.

PyCon: PyCon US 2020 Hatchery Program Launches Call for Proposals

$
0
0
The PyCon US Hatchery Program has become a fundamental part of how PyCon as a conference adapts to best serve the Python community as it grows and changes with time.

Initially we wanted to gauge community interest for this type of program, and since launching in 2018 we have learned more about what kind of events the community might propose. At the end of the inaugural program, we accepted the PyCon Charlas as our first Hatchery event which has grown into a permanent track offered at PyCon US.

PyCon US 2019 presented 3 new hatchery programs, Mentored Sprints, the Maintainers Summit, and the Art of Python. This year we are hoping to continue that growth, and are encouraging more organizers to propose their event ideas. If you are intrigued by the idea of proposing a hatchery event you may also want to look at Sumana Harihareswara's excellent write ups of both the motivation and execution of the Art of Python.

The long-term goals of this program are to support and grow sustainable programs that will become a recurring part of PyCon or find their place as a stand-alone event in the future. Programs that may be of specific temporal interest are also welcome, but will generally be given lower priority.

Our goal is to continue improving our community through inclusivity and diversity efforts. We hope that other international conferences, regional conferences, and local user groups can find inspiration in these efforts as they have in the past, adapting components of PyCon US into their own organizing.

Changes for 2020

  • Updates to the application process have been implemented. All proposals will be submitted through us.pycon.org in order to standardize the format and content from each proposal.
  • Improvements to how we support events with specific needs with respect to onsite support and room set-up.

Ready to submit your proposal?

The Hatchery Program CFP is open now. You can find the details here. Submit Hatchery proposals online here. Proposals will be accepted through January 3, 2020 AoE.

PyCharm: Webinar Preview: “Starting Testing” tutorial step for React+TS+TDD

$
0
0

As a reminder… next Wednesday (Oct 16) I’m giving a webinar on React+TypeScript+TDD in PyCharm. I’m doing some blog posts about material that will be covered.

webinar2019_watch-the-recording-171

See the first blog post for some background on this webinar and its topic.

Spotlight: Starting Testing

The first tutorial steps got us setup in the IDE, with a sample project generated and cleaned up. Now it’s time to learn React and TypeScript by…writing tests?

Indeed! This tutorial is trying to sell you on the idea that you’ll be more productive and happier writing and using your components from inside the IDE, instead of constantly heading over to the browser. For most of the steps in the tutorial, you do all of the learning, typing, and running from within a test, staying in the IDE and in the “flow”.

That’s the point of this tutorial step covering testing. Get you into a Jest run configuration, code on the left, tests on right, test runner at the bottom. We write some tests, “fail faster”, and get introduced to Jest and Enzyme.

Here’s the narrated video to go along with this tutorial step:

If you’re interested in more, here’s the entire tutorial. Hope to see you next week.

PyCharm: 2019.3 EAP 5

$
0
0

A new version of the Early Access Program (EAP) for PyCharm 2019.3 is available now! Download it from our website.

New for this version

Toggle between relative and absolute imports

PyCharm now has the ability to add imports using relative and absolute within a source root. Use intention actions to convert absolute imports into relative and relative imports into absolute.

change-relative-absolute

The usage of relative paths is also available through the import assistant. You can add relative imports when fixing missing imports within your current source root.

autoimport

Select testing framework for all New Projects

PyCharm now allows you to preselect a default test runner for newly created projects. To configure this go to File | Settings for New Projects

 for Windows and Linux, or File | Preferences for New Projects for macOS. Select Tools | Python Integrated Tools and under the Testing section choose your desired test runner.

MongoDB support is here!

We are excited to announce that we now have initial support for MongoDB. Available already in this EAP, use functionality such as observing collections and fields in the database explorer, using the data viewer to explore your data, and performing queries in the query console.

FrameCapture 2019-10-10 at 05.31.15 PM

If you wish to explore more about this feature click here.

Improved Github experience

The Get from Version Control dialog was improved. There’s now an option available for Github projects specifically to select repositories where you can scroll through a list of available repositories in your account.

Another improvement that you will be able to use is the Github Pull Request window (accessible through VCS | Git | View Pull Requests) which shows you the list of all the pull requests in the project you’re working with, their status and changed files. In addition, if you feel curious to see additional data regarding a pull request, double-click on the pull request you wish to explore and get comments, information about reviews and more.

Further improvements

  • We fixed an issue caused by packages installed as editable that lead to unresolved references.
  • The stub packages usage experience was improved:
    • The incompatible suggestions between stub packages and runtime packages are no longer an issue.
    • PyCharm will now suggest you newer versions if available.
  • For more details on what’s new in this version, see the release notes

Interested?

Download this EAP from our website. Alternatively, you can use the JetBrains Toolbox App to stay up to date throughout the entire EAP.

If you’re on Ubuntu 16.04 or later, you can use snap to get PyCharm EAP, and stay up to date. You can find the installation instructions on our website.

Python Bytes: #151 Certified! It works on my machine


Talk Python to Me: #233 The Masonite Python Web Framework

$
0
0
Folks, it's not like the old days where there were just a couple of web frameworks for building apps with Python. These days there are many. One of those frameworks is the Masonite web framework created by Joseph Mancuso. Joseph is here today to tell us all about Masonite, what makes it special, it's core value proposition for web developers and much more.

Catalin George Festila: Python 3.7.4 : Testing the PyUSB python module.

$
0
0
This python module named PyUSB can be found at pypi website. [mythcat@desk scripts]$ pip3 install pyusb --user Collecting pyusb ... Successfully installed pyusb-1.0.2Let' see some usb device with lsusb command: [mythcat@desk scripts]$ lsusb Bus 002 Device 002: ID 8087:0024 Intel Corp. Integrated Rate Matching Hub Bus 002 Device 001: ID 1d6b:0002 Linux Foundation 2.0 root hub Bus 001 Device 004:

Continuum Analytics Blog: How to Restore Anaconda after Update to MacOS Catalina

Dataquest: How to Analyze Survey Data with Python for Beginners

Test and Code: 90: Dynamic Scope Fixtures in pytest 5.2 - Anthony Sotille

$
0
0

pytest 5.2 was just released, and with it, a cool fun feature called dynamic scope fixtures. Anthony Sotille so tilly is one of the pytest core developers, so I thought it be fun to have Anthony describe this new feature for us.

We also talk about parametrized testing and really what is fixture scope and then what is dynamic scope.

Special Guest: Anthony Sottile.

Sponsored By:

Support Test & Code - Python Testing & Development

Links:

<p>pytest 5.2 was just released, and with it, a cool fun feature called dynamic scope fixtures. Anthony Sotille so tilly is one of the pytest core developers, so I thought it be fun to have Anthony describe this new feature for us.</p> <p>We also talk about parametrized testing and really what is fixture scope and then what is dynamic scope.</p><p>Special Guest: Anthony Sottile.</p><p>Sponsored By:</p><ul><li><a href="https://testandcode.com/raygun" rel="nofollow">Raygun</a>: <a href="https://testandcode.com/raygun" rel="nofollow">Detect, diagnose, and destroy Python errors that are affecting your customers. With smart Python error monitoring software from Raygun.com, you can be alerted to issues affecting your users the second they happen.</a></li></ul><p><a href="https://www.patreon.com/testpodcast" rel="payment">Support Test & Code - Python Testing & Development</a></p><p>Links:</p><ul><li><a href="https://pytest.org/en/latest/changelog.html" title="pytest changelog" rel="nofollow">pytest changelog</a></li><li><a href="https://docs.pytest.org/en/latest/fixture.html#scope-sharing-a-fixture-instance-across-tests-in-a-class-module-or-session" title="pytest fixtures" rel="nofollow">pytest fixtures</a></li><li><a href="https://docs.pytest.org/en/latest/fixture.html#dynamic-scope" title="dynamic scope fixtures" rel="nofollow">dynamic scope fixtures</a></li><li><a href="https://testandcode.com/82" title="episode 82: pytest - favorite features since 3.0 " rel="nofollow">episode 82: pytest - favorite features since 3.0 </a></li><li><a href="https://amzn.to/2QnzvUv" title="the pytest book" rel="nofollow">the pytest book</a> &mdash; Python Testing with pytest</li></ul>

Stack Abuse: Autoencoders for Image Reconstruction in Python and Keras

$
0
0

Introduction

Nowadays, we have huge amounts of data in almost every application we use - listening to music on Spotify, browsing friend's images on Instagram, or maybe watching an new trailer on YouTube. There is always data being transmitted from the servers to you.

This wouldn't be a problem for a single user. But imagine handling thousands, if not millions, of requests with large data at the same time. These streams of data have to be reduced somehow in order for us to be physically able to provide them to users - this is where data compression kicks in.

There're lots of compression techniques, and they vary in their usage and compatibility. For example some compression techniques only work on audio files, like the famous MPEG-2 Audio Layer III (MP3) codec.

There are two main types of compression:

  • Lossless: Data integrity and accuracy is preferred, even if we don't "shave off" much
  • Lossy: Data integrity and accuracy isn't as important as how fast we can serve it - imagine a real-time video transfer, where it's more important to be "live" than to have high quality video

For example, using Autoencoders, we're able to decompose this image and represent it as the 32-vector code below. Using it, we can reconstruct the image. Of course, this is an example of lossy compression, as we've lost quite a bit of info.

autoencoder

Though, we can use the exact same technique to do this much more accurately, by allocating more space for the representation:

alt

What are Autoencoders?

An autoencoder is, by definition, a technique to encode something automatically. By using a neural network, the autoencoder is able to learn how to decompose data (in our case, images) into fairly small bits of data, and then using that representation, reconstruct the original data as closely as it can to the original.

There are two key components in this task:

  • Encoder: Learns how to compress the original input into a small encoding
  • Decoder: Learns how to restore the original data from that encoding generated by the Encoder

These two are trained together in symbiosis to obtain the most efficient representation of the data that we can reconstruct the original data from, without losing so much of it.

autoencoder

Credit: ResearchGate

Encoder

The Encoder is tasked with finding the smallest possible representation of data that it can store - extracting the most prominent features of the original data and representing it in a way the decoder can understand.

Think of it as if you are trying to memorize something, like for example memorizing a large number - you try to find a pattern in it that you can memorize and restore the whole sequence from that pattern, as it will be easy to remember shorter pattern than the whole number.

Encoders in their simplest form are simple Artificial Neural Networks (ANNs). Though, there are certain encoders that utilize Convolutional Neural Networks (CNNs), which is a very specific type of ANN.

The encoder takes the input data and generates an encoded version of it - the compressed data. We can then use that compressed data to send it to the user, where it will be decoded and reconstructed. Let's take a look at the encoding for a LFW dataset example:

encodings

The encoding here doesn't make much sense for us, but it's plenty enough for the decoder. Now, it's valid to raise the question:

"But how did the encoder learn to compress images like this?

This is where the symbiosis during training comes into play.

Decoder

The Decoder works in a similar way to the encoder, but the other way around. It learns to read, instead of generate, these compressed code representations and generate images based on that info. It aims to minimize the loss while reconstructing, obviously.

The output is evaluated by comparing the reconstructed image by the original one, using a Mean Square Error (MSE) - the more similar it is to the original, the smaller the error.

At this point, we propagate backwards and update all the parameters from the decoder to the encoder. Therefore, based on the differences between the input and output images, both the decoder and encoder get evaluated at their jobs and update their parameters to become better.

Building an Autoencoder

Keras is a Python framework that makes building neural networks simpler. It allows us to stack layers of different types to create a deep neural network - which we will do to build an autoencoder.

First, let's install Keras using pip:

$ pip install keras

Preprocessing Data

Again, we'll be using the LFW dataset. As usual, with projects like these, we'll preprocess the data to make it easier for our autoencoder to do its job.

For this, we'll first define a couple of paths which lead to the dataset we're using:

# http://www.cs.columbia.edu/CAVE/databases/pubfig/download/lfw_attributes.txt
ATTRS_NAME = "lfw_attributes.txt"

# http://vis-www.cs.umass.edu/lfw/lfw-deepfunneled.tgz
IMAGES_NAME = "lfw-deepfunneled.tgz"

# http://vis-www.cs.umass.edu/lfw/lfw.tgz
RAW_IMAGES_NAME = "lfw.tgz"

Then, we'll employ two functions - one to convert the raw matrix into an image and change the color system to RGB:

def decode_image_from_raw_bytes(raw_bytes):
    img = cv2.imdecode(np.asarray(bytearray(raw_bytes), dtype=np.uint8), 1)
    img = cv2.cvtColor(img, cv2.COLOR_BGR2RGB)
    return img

And the other one to actually load the dataset and adapt it to our needs:

def load_lfw_dataset(
        use_raw=False,
        dx=80, dy=80,
        dimx=45, dimy=45):

    # Read attrs
    df_attrs = pd.read_csv(ATTRS_NAME, sep='\t', skiprows=1)
    df_attrs = pd.DataFrame(df_attrs.iloc[:, :-1].values, columns=df_attrs.columns[1:])
    imgs_with_attrs = set(map(tuple, df_attrs[["person", "imagenum"]].values))

    # Read photos
    all_photos = []
    photo_ids = []

    # tqdm in used to show progress bar while reading the data in a notebook here, you can change
    # tqdm_notebook to use it outside a notebook
    with tarfile.open(RAW_IMAGES_NAME if use_raw else IMAGES_NAME) as f:
        for m in tqdm.tqdm_notebook(f.getmembers()):
            # Only process image files from the compressed data
            if m.isfile() and m.name.endswith(".jpg"):
                # Prepare image
                img = decode_image_from_raw_bytes(f.extractfile(m).read())

                # Crop only faces and resize it
                img = img[dy:-dy, dx:-dx]
                img = cv2.resize(img, (dimx, dimy))

                # Parse person and append it to the collected data
                fname = os.path.split(m.name)[-1]
                fname_splitted = fname[:-4].replace('_', ' ').split()
                person_id = ' '.join(fname_splitted[:-1])
                photo_number = int(fname_splitted[-1])
                if (person_id, photo_number) in imgs_with_attrs:
                    all_photos.append(img)
                    photo_ids.append({'person': person_id, 'imagenum': photo_number})

    photo_ids = pd.DataFrame(photo_ids)
    all_photos = np.stack(all_photos).astype('uint8')

    # Preserve photo_ids order!
    all_attrs = photo_ids.merge(df_attrs, on=('person', 'imagenum')).drop(["person", "imagenum"], axis=1)

    return all_photos, all_attrs

Implementing the Autoencoder

import numpy as np
X, attr = load_lfw_dataset(use_raw=True, dimx=32, dimy=32)

Our data is in the X matrix, in the form of a 3D matrix, which is the default representation for RGB images. By providing three matrices - red, green, and blue, the combination of these three generate the image color.

These images will have large values for each pixel, ranging from 0 to 255. Generally in machine learning we tend to make values small, and centered around 0, as this helps our model train faster and get better results, so let's normalize our images:

X = X.astype('float32') / 255.0 - 0.5

By now if we test the X array for the min and max it will be -.5 and .5, which you can verify:

print(X.max(), X.min())
0.5 -0.5

To be able to see the image, let's create a show_image function. It will add 0.5 to the images as the pixel value can't be negative:

import matplotlib.pyplot as plt
def show_image(x):
    plt.imshow(np.clip(x + 0.5, 0, 1))

Now let's take a quick look at our data:

show_image(X[6])

face

Great, now let's split our data into a training and test set:

from sklearn.model_selection import train_test_split
X_train, X_test = train_test_split(X, test_size=0.1, random_state=42)

The sklearn train_test_split() function is able to split the data by giving it the test ratio and the rest is, of course, the training size. The random_state, which you are going to see a lot in machine learning, is used to produce the same results no matter how many times you run the code.

Now time for the model:

from keras.layers import Dense, Flatten, Reshape, Input, InputLayer
from keras.models import Sequential, Model

def build_autoencoder(img_shape, code_size):
    # The encoder
    encoder = Sequential()
    encoder.add(InputLayer(img_shape))
    encoder.add(Flatten())
    encoder.add(Dense(code_size))

    # The decoder
    decoder = Sequential()
    decoder.add(InputLayer((code_size,)))
    decoder.add(Dense(np.prod(img_shape))) # np.prod(img_shape) is the same as 32*32*3, it's more generic than saying 3072
    decoder.add(Reshape(img_shape))

    return encoder, decoder

This function takes an image_shape (image dimensions) and code_size (the size of the output representation) as parameters. The image shape, in our case, will be (32, 32, 3) where 32 represent the width and height, and 3 represents the color channel matrices. That being said, our image has 3072 dimensions.

Logically, the smaller the code_size is, the more the image will compress, but the less features will be saved and the reproduced image will be that much more different from the original.

A Keras sequential model is basically used to sequentially add layers and deepen our network. Each layer feeds into the next one, and here, we're simply starting off with the InputLayer (a placeholder for the input) with the size of the input vector - image_shape.

The Flatten layer's job is to flatten the (32,32,3) matrix into a 1D array (3072) since the network architecture doesn't accept 3D matrices.

The last layer in the encoder is the Dense layer, which is the actual neural network here. It tries to find the optimal parameters that achieve the best output - in our case it's the encoding, and we will set the output size of it (also the number of neurons in it) to the code_size.

The decoder is also a sequential model. It accepts the input (the encoding) and tries to reconstruct it in the form of a row. Then, it stacks it into a 32x32x3 matrix through the Dense layer. The final Reshape layer will reshape it into an image.

Now let's connect them together and start our model:

# Same as (32,32,3), we neglect the number of instances from shape
IMG_SHAPE = X.shape[1:]
encoder, decoder = build_autoencoder(IMG_SHAPE, 32)

inp = Input(IMG_SHAPE)
code = encoder(inp)
reconstruction = decoder(code)

autoencoder = Model(inp,reconstruction)
autoencoder.compile(optimizer='adamax', loss='mse')

print(autoencoder.summary())

This code is pretty straightforward - our code variable is the output of the encoder, which we put into the decoder and generate the reconstruction variable.

Afterwards, we link them both by creating a Model with the the inp and reconstruction parameters and compile them with the adamax optimizer and mse loss function.

Compiling the model here means defining its objective and how to reach it. The objective in our context is to minimize the mse and we reach that by using an optimizer - which is basically a tweaked algorithm to find the global minimum.

At this point, we can summarize the results:

_________________________________________________________________
Layer (type)                 Output Shape              Param #
=================================================================
input_6 (InputLayer)         (None, 32, 32, 3)         0
_________________________________________________________________
sequential_3 (Sequential)    (None, 32)                98336
_________________________________________________________________
sequential_4 (Sequential)    (None, 32, 32, 3)         101376
=================================================================
Total params: 199,712
Trainable params: 199,712
Non-trainable params: 0
_________________________________________________________________

Here we can see the input is 32,32,3. Note the None here refers to the instance index, as we give the data to the model it will have a shape of (m, 32,32,3), where m is the number of instances, so we keep it as None.

The hidden layer is 32, which is indeed the encoding size we chose, and lastly the decoder output as you see is (32,32,3).

Now, let's trade the model:

history = autoencoder.fit(x=X_train, y=X_train, epochs=20,
                validation_data=[X_test, X_test])

In our case, we'll be comparing the constructed images to the original ones, so both x and y are equal to X_train. Ideally, the input is equal to the output.

The epochs variable defines how many times we want the training data to be passed through the model and the validation_data is the validation set we use to evaluate the model after training:

Train on 11828 samples, validate on 1315 samples
Epoch 1/20
11828/11828 [==============================] - 3s 272us/step - loss: 0.0128 - val_loss: 0.0087
Epoch 2/20
11828/11828 [==============================] - 3s 227us/step - loss: 0.0078 - val_loss: 0.0071
.
.
.
Epoch 20/20
11828/11828 [==============================] - 3s 237us/step - loss: 0.0067 - val_loss: 0.0066

We can visualize the loss over epochs to get an overview about the epochs number.

plt.plot(history.history['loss'])
plt.plot(history.history['val_loss'])
plt.title('model loss')
plt.ylabel('loss')
plt.xlabel('epoch')
plt.legend(['train', 'test'], loc='upper left')
plt.show()

loss/epoch

We can see that after the third epoch, there's no significant progress in loss. Visualizing like this can help you get a better idea of how many epochs is really enough to train your model. In this case, there's simply no need to train it for 20 epochs, and most of the training is redundant.

This can also lead to over-fitting the model, which will make it perform poorly on new data outside the training and testing datasets.

Now, the most anticipated part - let's visualize the results:

def visualize(img,encoder,decoder):
    """Draws original, encoded and decoded images"""
    # img[None] will have shape of (1, 32, 32, 3) which is the same as the model input
    code = encoder.predict(img[None])[0]
    reco = decoder.predict(code[None])[0]

    plt.subplot(1,3,1)
    plt.title("Original")
    show_image(img)

    plt.subplot(1,3,2)
    plt.title("Code")
    plt.imshow(code.reshape([code.shape[-1]//2,-1]))

    plt.subplot(1,3,3)
    plt.title("Reconstructed")
    show_image(reco)
    plt.show()

for i in range(5):
    img = X_test[i]
    visualize(img,encoder,decoder)

pca encoder results
pca encoder results-2
pca encoder results-3
pca encoder results-4
pca encoder results-5

You can see that the results are not really good. However, if we take into consideration that the whole image is encoded in the extremely small vector of 32 seen in the middle, this isn't bad at all. Through the compression from 3072 dimensions to just 32 we lose a lot of data.

Now, let's increase the code_size to 1000:

pca 1000 results
pca 1000 results
pca 1000 results
pca 1000 results
pca 1000 results

See the difference? As you give the model more space to work with, it saves more important information about the image

Note: The encoding is not two-dimensional, as represented above. This is just for illustration purposes. In reality, it's a one dimensional array of 1000 dimensions.

What we just did is called Principal Component Analysis (PCA), which is a dimensionality reduction technique. We can use it to reduce the feature set size by generating new features that are smaller in size, but still capture the important information.

Principal component analysis is a very popular usage of autoencoders.

Image Denoising

Another popular usage of autoencoders is denoising. Let's add some random noise to our pictures:

def apply_gaussian_noise(X, sigma=0.1):
    noise = np.random.normal(loc=0.0, scale=sigma, size=X.shape)
    return X + noise

Here we add some random noise from standard normal distribution with a scale of sigma, which defaults to 0.1.

For reference, this is what noise looks like with different sigma values:

plt.subplot(1,4,1)
show_image(X_train[0])
plt.subplot(1,4,2)
show_image(apply_gaussian_noise(X_train[:1],sigma=0.01)[0])
plt.subplot(1,4,3)
show_image(apply_gaussian_noise(X_train[:1],sigma=0.1)[0])
plt.subplot(1,4,4)
show_image(apply_gaussian_noise(X_train[:1],sigma=0.5)[0])

noise

As we can see, as sigma increases to 0.5 the image is barely seen. We will try to regenerate the original image from the noisy ones with sigma of 0.1.

The model we'll be generating for this is the same as the one from before, though we'll train it differently. This time around, we'll train it with the original and corresponding noisy images:

code_size = 100

# We can use bigger code size for better quality
encoder, decoder = build_autoencoder(IMG_SHAPE, code_size=code_size)

inp = Input(IMG_SHAPE)
code = encoder(inp)
reconstruction = decoder(code)

autoencoder = Model(inp, reconstruction)
autoencoder.compile('adamax', 'mse')

for i in range(25):
    print("Epoch %i/25, Generating corrupted samples..."%(i+1))
    X_train_noise = apply_gaussian_noise(X_train)
    X_test_noise = apply_gaussian_noise(X_test)

    # We continue to train our model with new noise-augmented data
    autoencoder.fit(x=X_train_noise, y=X_train, epochs=1,
                    validation_data=[X_test_noise, X_test])

Now let's see the model results:

X_test_noise = apply_gaussian_noise(X_test)
for i in range(5):
    img = X_test_noise[i]
    visualize(img,encoder,decoder)

denoising
denoising
denoising
denoising
denoising

Autoencoder Applications

There are many more usages for autoencoders, besides the ones we've explored so far.

Autoencoder can be used in applications like Deepfakes, where you have an encoder and decoder from different models.

For example, let's say we have two autoencoders for Person X and one for Person Y. There's nothing stopping us from using the encoder of Person X and the decoder of Person Y and then generate images of Person Y with the prominent features of Person X:

face swap

Credit: AlanZucconi

Autoencoders can also used for image segmentation - like in autonomous vehicles where you need to segment different items for the vehicle to make a decision:

image seg

Credit: PapersWithCode

Conclusion

Autoencoders can bed used for Principal Component Analysis which is a dimensionality reduction technique, image denoising and much more.

You can try it yourself with different dataset, like for example the MNIST dataset and see what results you get.

PyCharm: Webinar Preview: “Debugging During Testing” tutorial step for React+TS+TDD

$
0
0

As a reminder… next Wednesday (Oct 16) I’m giving a webinar on React+TypeScript+TDD in PyCharm. I’m doing some blog posts about material that will be covered.

webinar2019_watch-the-recording-171

See the first blog post for some background on this webinar and its topic.

Spotlight: Debugging During Testing

I often speak about “visual debugging” and “visual testing”, meaning, how IDEs can help put these intermediate concepts within reach using a visual UI.

For testing, sometimes our code has problems that require investigation with a debugger. For React, that usually means a trip to the browser to set a breakpoint and use the Chrome developer tools. In Debugging During Testing With NodeJS we show how the IDE’s debugger, combined with TDD, can make this investigation far more productive. In the next step we show how to do so using Chrome as the execution environment.

Here’s the first video:

Then the second step, showing debugging in Chrome:

TDD is a process of exploration, as well as productive way to write code while staying in the “flow”. The debugger helps on both of those and is an essential tool during test writing.


Roberto Alsina: Episodio 10: Una Línea

$
0
0

Una línea. Estás viendo código y te cruzás con una línea que ... ¿que miércoles es esa línea? ¿Con qué se come? ¿Qué se hace?

Expresiones regulares, intentos de explicaciones poco convincentes y más!

PyCharm: Webinar Preview: “Functional React Components in TypeScript” tutorial step for React+TS+TDD

$
0
0

As a reminder… next Wednesday (Oct 16) I’m giving a webinar on React+TypeScript+TDD in PyCharm. I’m doing some blog posts about material that will be covered.

webinar2019_watch-the-recording-171

See the first blog post for some background on this webinar and its topic.

Spotlight: Functional React Components in TypeScript

Note: I’m skipping over a blog post for the tutorial step TSX and ES6 tutorial step. Should have started these spotlight blog posts sooner!

One thing is for sure about the React Zen: they promote lots and lots of tiny components. Which fits in very well with this tutorial’s TDD approach. Uncle Bob refers to this as the Single Responsibility Principle and SRP is mentioned frequently in React.

In the Functional React Components in TypeScript tutorial step we extract some markup and logic from the component into a Heading subcomponent. In this first step we don’t extract state or logic. We do, though, write tests first and learn a little more about the ways to interact with the DOM of a React component from within a test.

Here’s the narrated video for this step:

Python Insider: Python 3.5.8rc2 is now available

PyCharm: Webinar Preview: “Sharing Props Using Type Information” tutorial step for React+TS+TDD

$
0
0

As a reminder… next Wednesday (Oct 16) I’m giving a webinar on React+TypeScript+TDD in PyCharm. I’m doing some blog posts about material that will be covered.

webinar2019_watch-the-recording-171

See the first blog post for some background on this webinar and its topic.

Spotlight: Sharing Props Using Type Information

Now we get to some fun stuff: Sharing Props Using Type Information.

When you have lots of small components, they share information from parent “smart” components to child “dumb” (or presentation) components. This information is shared via properties, which forms the contract.

How do you write down that contract? This is where doing your React projects in TypeScript really shines. You can make an interface for your property information and say that your component’s properties conform to that interface. You gain IDE autocomplete, warnings, and more.

This really shines in TDD. You “fail faster” with visual squiggles that indicate you broke the contract, rather than waiting for the test to run.

This tutorial step shows a React functional component with property information in an interface, along with showing how to allow a default value for a prop. All done from a test-first workflow:

Learn PyQt: Plotting in PyQt5 — Using PyQtGraph to create interactive plots in your apps

$
0
0

One of the major strengths of Python is in exploratory data science and visualization, using tools such as Pandas, numpy, sklearn for data analysis and matplotlib plotting. Buiding GUI applications with PyQt gives you access to all these Python tools directly from within your app, allowing you to build complex data-driven apps and interactive dashboards.

While it is possible to embed matplotlib plots in PyQt the experience does not feel entirely native. For simple and highly interactive plots you may want to consider using PyQtGraph instead. PyQtGraph is built on top of PyQ5 native QGraphicsScene giving better drawing performance, particularly for live data, as well as providing interactivity and the ability to easily customize plots with Qt graphics widgets.

In this tutorial we'll walk through the first steps of creating a plot widget with PyQtGraph and then demonstrate plot customization using line colours, line type, axis labels, background colour and plotting multiple lines.

Getting started

To be able to use PyQtGraph with PyQt you first need to install the package to your Python environment. You can do this as normal using pip.

bash
pip install pyqtgraph

Once the installation is complete you should be able to import the module as normal.

Creating a PyQtGraph widget

In PyQtGraph all plots are created using the PlotWidget widget. This widget provides a contained canvas on which plots of any type can be added and configured. Under the hood, this plot widget uses Qt native QGraphicsScene meaning it fast and efficient yet simple to integrate with the rest of your app. You can create a PlotWidget as for any other widget.

The basic template app, with a single PlotWidget in a QMainWindow is shown below.

In the following examples we'll create the PyQtGraph widget in code. Want to know how to embed PyQtGraph when using Qt Designer? See Embedding custom widgets from Qt Designer

python
fromPyQt5importQtWidgets,uicfrompyqtgraphimportPlotWidget,plotimportpyqtgraphaspgimportsys# We need sys so that we can pass argv to QApplicationimportosclassMainWindow(QtWidgets.QMainWindow):def__init__(self,*args,**kwargs):super(MainWindow,self).__init__(*args,**kwargs)self.graphWidget=pg.PlotWidget()self.setCentralWidget(self.graphWidget)hour=[1,2,3,4,5,6,7,8,9,10]temperature=[30,32,34,32,33,31,29,32,35,45]# plot data: x, y valuesself.graphWidget.plot(hour,temperature)defmain():app=QtWidgets.QApplication(sys.argv)main=MainWindow()main.show()sys.exit(app.exec_())if__name__=='__main__':main()

In all our examples below we import PyQtGraph using import pyqtgraph as pg. This is a common convention in PyQtGraph examples to keep things tidy & reduce typing. You an import and use it as import pyqtgraph if you prefer.

The custom PyQtGraph widget showing dummy data. The custom PyQtGraph widget showing dummy data.

The default plot style of PyQtGraph is quite bare — a black background with a thin (barely visible) white line. In the next section we'll look at what options we have available to us in PyQtGraph to improve the appearance and usability of our plots.

Styling plots

PyQtGraph uses Qt's QGraphicsScene to render the graphs. This gives us access to all the standard Qt line and shape styling options for use in plots. However, PyQtGraph provides an API for using these to draw plots and manage the plot canvas.

Below we'll go through the most common styling features you'll need to create and customize your own plots.

Background Colour

Beginning with the app skeleton above, we can change the background colour by calling .setBackground on our PlotWidget instance (in self.graphWidget). The code below will set the background to white, by passing in the string 'w'.

self.graphWidget.setBackground('w')

You can set (and update) the background colour of the plot at any time.

python
fromPyQt5importQtWidgets,uicfrompyqtgraphimportPlotWidget,plotimportpyqtgraphaspgimportsys# We need sys so that we can pass argv to QApplicationimportosclassMainWindow(QtWidgets.QMainWindow):def__init__(self,*args,**kwargs):super(MainWindow,self).__init__(*args,**kwargs)self.graphWidget=pg.PlotWidget()self.setCentralWidget(self.graphWidget)hour=[1,2,3,4,5,6,7,8,9,10]temperature=[30,32,34,32,33,31,29,32,35,45]self.graphWidget.setBackground('w')self.graphWidget.plot(hour,temperature)defmain():app=QtWidgets.QApplication(sys.argv)main=MainWindow()main.show()sys.exit(app.exec_())if__name__=='__main__':main()
Change PyQtGraph Plot Background to White Change PyQtGraph Plot Background to White

There are a number of simple colours available using single letters, based on the standard colours used in matplotlib. They're pretty unsurprising, except that 'k' is used for black.

Colour Letter code
blue b
green g
red r
cyan (bright blue-green) c
magenta (bright pink) m
yellow y
black k
white w

In addition to these single letter codes, you can also set more complex colours using hex notation eg. #672922 as a string.

self.graphWidget.setBackground('#bbccaa')# hex

RGB and RGBA values can be passed in as a 3-tuple or 4-tuple respectively, using values 0-255.

self.graphWidget.setBackground((100,50,255))# RGB each 0-255self.graphWidget.setBackground((100,50,255,25))# RGBA (A = alpha opacity)

Lastly, you can also specify colours using Qt's QColor type directly.

fromPyQt5importQtGui# Place this at the top of your file.self.graphWidget.setBackground(QtGui.QColor(100,50,254,25))

This can be useful if you're using specific QColor objects elsewhere in your application, or to set your plot background to the default GUI background colour.

color=self.palette().color(QtGui.QPalette.Window)# Get the default window background,self.graphWidget.setBackground(color)

Line Colour, Width & Style

Lines in PyQtGraph are drawn using standard Qt QPen types. This gives you the same full control over line drawing as you would have in any other QGraphicsScene drawing. To use a pen to plot a line, you simply create a new QPen instance and pass it into the plot method.

Below we create a QPen object, passing in a 3-tuple of int values specifying an RGB value (of full red). We could also define this by passing 'r', or a QColor object. Then we pass this into plot with the pen parameter.

pen=pg.mkPen(color=(255,0,0))self.graphWidget.plot(hour,temperature,pen=pen)

The complete code is shown below.

python
fromPyQt5importQtWidgets,uicfrompyqtgraphimportPlotWidget,plotimportpyqtgraphaspgimportsys# We need sys so that we can pass argv to QApplicationimportosclassMainWindow(QtWidgets.QMainWindow):def__init__(self,*args,**kwargs):super(MainWindow,self).__init__(*args,**kwargs)self.graphWidget=pg.PlotWidget()self.setCentralWidget(self.graphWidget)hour=[1,2,3,4,5,6,7,8,9,10]temperature=[30,32,34,32,33,31,29,32,35,45]self.graphWidget.setBackground('w')pen=pg.mkPen(color=(255,0,0))self.graphWidget.plot(hour,temperature,pen=pen)defmain():app=QtWidgets.QApplication(sys.argv)main=MainWindow()main.show()sys.exit(app.exec_())if__name__=='__main__':main()
Changing Line Colour Changing Line Colour

By changing the QPen object we can change the appearance of the line, including both line width in pixels and style (dashed, dotted, etc.) using standard Qt line styles. For example, the following example creates a 15px width dashed line in red.

pen=pg.mkPen(color=(255,0,0),width=15,style=QtCore.Qt.DashLine)

The result is shown below, giving a 15px dashed red line.

Changing Line Width and Style Changing Line Width and Style

The standard Qt line styles can all be used, including Qt.SolidLine, Qt.DashLine, Qt.DotLine, Qt.DashDotLine and Qt.DashDotDotLine. Examples of each of these lines are shown in the image below, and you can read more in the Qt Documentation.

Qt Line Types Qt Line Types

Line Markers

For many plots it can be helpful to place markers in addition or instead of lines on the plot. To draw a marker on the plot, pass the symbol to use as a marker when calling .plot as shown below.

self.graphWidget.plot(hour,temperature,symbol='+')

In addition to symbol you can also pass in symbolSize, symbolBrush and symbolPen parameters. The value passed as symbolBrush can be any colour, or QBrush type, while symbolPen can be passed any colour or a QPen instance. The pen is used to draw the outline of the shape, while brush is used for the fill.

For example the below code will give a blue cross marker of size 30, on a thick red line.

pen=pg.mkPen(color=(255,0,0),width=15,style=QtCore.Qt.DashLine)self.graphWidget.plot(hour,temperature,pen=pen,symbol='+',symbolSize=30,symbolBrush=('b'))
Adding Symbols on Line Adding Symbols on Line

In addition to the + plot marker, PyQtGraph supports the following standard markers shown in the table below. These can all be used in the same way.

Variable Marker Type
o Circular
s Square
t Triangular
d Diamond
+ Cross

If you have more complex requirements you can also pass in any QPainterPath object, allowing you to draw completely custom marker shapes.

Plot Titles

Chart titles are important to provide context to what is shown on a given chart. In PyQtGraph you can add a main plot title using the setTitle() method on the PlotWidget, passing in your title string.

self.graphWidget.setTitle("Your Title Here")

You can apply text styles, including colours, font sizes and weights to your titles (and any other labels in PyQtGraph) by passing additional arguments. The available syle arguments are shown below.

Style Type
color (str) e.g. 'CCFF00'
size (str) e.g. '8pt'
bold (bool) True or False
italic (bool) True or False

The code below sets the color to blue with a font size of 30px.

self.graphWidget.setTitle("Your Title Here",color='blue',size=30)

You can also style your headers with HTML tag syntax if you prefer, although it's less readable.

self.graphWidget.setTitle("<span style=\"color:blue;font-size:30px\">Your Title Here</span>")
Adding Chart Title Adding Chart Title

Axis Labels

Similar to titles, we can use the setLabel() method to create our axis titles. This requires two parameters, position and text. The position can be any one of 'left,'right','top','bottom' which describe the position of the axis on which the text is placed. The 2nd parameter text is the text you want to use for the label.

self.graphWidget.setLabel('left','Temperature (°C)',color='red',size=30)self.graphWidget.setLabel('bottom','Hour (H)',color='red',size=30)

These take the same style parameters as setTitle and also support HTML syntax if you prefer.

self.graphWidget.setLabel('left',"<span style=\"color:red;font-size:30px\">Temperature (°C)</span>")self.graphWidget.setLabel('bottom',"<span style=\"color:red;font-size:30px\">Hour (H)</span>")
Add Axis Labels Add Axis Labels

Legends

In addition to the axis and plot titles you will often want to show a legend identifying what a given line represents. This is particularly important when you start adding multiple lines to a plot. Adding a legend to a plot can be accomplished by calling .addLegend on the PlotWidget, however before this will work you need to provide a name for each line when calling .plot().

The example below assigns a name "Sensor 1" to the line we are plotting with .plot(). This name will be used to identify the line in the legend.

self.graphWidget.plot(hour,temperature,name="Sensor 1",pen=NewPen,symbol='+',symbolSize=30,symbolBrush=('b'))self.graphWidget.addLegend()
Add Legend Add Legend

The legend appears in the top left by default. If you would like to move it, you can easily drag and drop the legend elsewhere. You can also specify a default offset by passing a 2-tuple to the offset parameter when creating the legend.

Background Grid

Adding a background grid can make your plots easier to read, particularly when trying to compare relative x & y values against each other. You can turn on a background grid for your plot by calling .showGrid on your PlotWidget. You can toggle x and y grids independently.

The following with create the grid for both the X and Y axis.

self.graphWidget.showGrid(x=True,y=True)
Add Grid Add Grid

Setting Axis Limits

Sometimes it can be useful to restrict the range of data which is visible on the plot, or to lock the axis to a consistent range regardless of the data input (e.g. a known min-max range). In PyQtGraph this can be done using the .setXRange() and .setYRange() methods. These force the plot to only show data within the specified ranges on each axis.

Below we set two ranges, one on each axis. The 1st argument is the minimum value and the 2nd is the maximum.

self.graphWidget.setXRange(5,20,padding=0)self.graphWidget.setYRange(30,40,padding=0)

A optional padding argument causes the range to be set larger than specified by the specified fraction (this between 0.02 and 0.1 by default, depending on the size of the ViewBox). If you want to remove this padding entirely, pass 0.

self.graphWidget.setXRange(5,20,padding=0)self.graphWidget.setYRange(30,40,padding=0)

The complete code so far is shown below:

python
fromPyQt5importQtWidgets,uic,QtCorefrompyqtgraphimportPlotWidget,plotimportpyqtgraphaspgimportsys# We need sys so that we can pass argv to QApplicationimportosclassMainWindow(QtWidgets.QMainWindow):def__init__(self,*args,**kwargs):super(MainWindow,self).__init__(*args,**kwargs)self.graphWidget=pg.PlotWidget()self.setCentralWidget(self.graphWidget)hour=[1,2,3,4,5,6,7,8,9,10]temperature=[30,32,34,32,33,31,29,32,35,45]#Add Background colour to whiteself.graphWidget.setBackground('w')#Add Titleself.graphWidget.setTitle("Your Title Here",color='blue',size=30)#Add Axis Labelsself.graphWidget.setLabel('left','Temperature (°C)',color='red',size=30)self.graphWidget.setLabel('bottom','Hour (H)',color='red',size=30)#Add legendself.graphWidget.addLegend()#Add gridself.graphWidget.showGrid(x=True,y=True)#Set Rangeself.graphWidget.setXRange(0,10,padding=0)self.graphWidget.setYRange(20,55,padding=0)pen=pg.mkPen(color=(255,0,0))self.graphWidget.plot(hour,temperature,name="Sensor 1",pen=pen,symbol='+',symbolSize=30,symbolBrush=('b'))defmain():app=QtWidgets.QApplication(sys.argv)main=MainWindow()main.show()sys.exit(app.exec_())if__name__=='__main__':main()
Set Axis Range Set Axis Range

Plotting multiple lines

It is common for plots to involve more than one line. In PyQtGraph this is as simple as calling .plot() multiple times on the same PlotWidget. In the following example we're going to plot two lines of similar data, using the same line styles, thicknesses etc. for each, but changing the line colour.

To simplify this we can create our own custom plot method on our MainWindow. This accepts x and y parameters to plot, the name of the line (for the legend) and a colour. We use the colour for both the line and marker colour.

defplot(self,x,y,plotname,color):pen=pg.mkPen(color=color)self.graphWidget.plot(x,y,name=plotname,pen=pen,symbol='+',symbolSize=30,symbolBrush=(color))

To plot separate lines we'll create a new array called temperature_2 and populate it with random numbers similar to temperature (now temperature_1). Plotting these alongside each other allows us to compare them together.

Now, you can call plot function twice and this will generate 2 lines on the plot.

self.plot(hour,temperature_1,"Sensor1",'r')self.plot(hour,temperature_2,"Sensor2",'b')
python
fromPyQt5importQtWidgets,uic,QtCorefrompyqtgraphimportPlotWidget,plotimportpyqtgraphaspgimportsys# We need sys so that we can pass argv to QApplicationimportosclassMainWindow(QtWidgets.QMainWindow):def__init__(self,*args,**kwargs):super(MainWindow,self).__init__(*args,**kwargs)self.graphWidget=pg.PlotWidget()self.setCentralWidget(self.graphWidget)hour=[1,2,3,4,5,6,7,8,9,10]temperature_1=[30,32,34,32,33,31,29,32,35,45]temperature_2=[50,35,44,22,38,32,27,38,32,44]#Add Background colour to whiteself.graphWidget.setBackground('w')#Add Titleself.graphWidget.setTitle("<h style=\"color:blue;font-size:30px\">Your Title Here</h>")#Add Axis Labelsself.graphWidget.setLabel('left',"<h style=\"color:red;font-size:30px\">Temperature (°C)</h>")self.graphWidget.setLabel('bottom',"<h style=\"color:red;font-size:30px\">Hour (H)</h>")#Add legendself.graphWidget.addLegend()#Add gridself.graphWidget.showGrid(x=True,y=True)#Set Rangeself.graphWidget.setXRange(0,10,padding=0)self.graphWidget.setYRange(20,55,padding=0)self.plot(hour,temperature_1,"Sensor1",'r')self.plot(hour,temperature_2,"Sensor2",'b')defplot(self,x,y,plotname,color):pen=pg.mkPen(color=color)self.graphWidget.plot(x,y,name=plotname,pen=pen,symbol='+',symbolSize=30,symbolBrush=(color))defmain():app=QtWidgets.QApplication(sys.argv)main=MainWindow()main.show()sys.exit(app.exec_())if__name__=='__main__':main()
2 Line Graph 2 Line Graph

Play around with this function, customising your markers, line widths, colours and other parameters.

Clearing the plot

Finally, sometimes you might want to clear and refresh the plot periodically. You can easily do that by calling .clear().

self.graphWidget.clear()

This will remove the lines from the plot but keep all other attributes the same.

Note that you don't need to clear and redraw lines to change the data on your plot. We'll cover updating existing plot lines on interactive plots in a future tutorial.

Conclusion

In this tutorial we've discovered how to draw simple plots with PyQtGraph and customize lines, markers and labels. For a complete overview of PyQtGraph methods and capabilities see the PyQtGraph Documentation & API Reference. The PyQtGraph repository on Github also has complete set of more complex example plots in Plotting.py (shown below).

PyQtGraph Repo Example (Plotting.py) PyQtGraph Repo Example (Plotting.py)
Viewing all 22859 articles
Browse latest View live


<script src="https://jsc.adskeeper.com/r/s/rssing.com.1596347.js" async> </script>