Quantcast
Channel: Planet Python
Viewing all 22880 articles
Browse latest View live

ListenData: 15 ways to read CSV file with pandas

$
0
0
This tutorial explains how to read a CSV file in python using read_csv function of pandas package. Without use of read_csv function, it is not straightforward to import CSV file with python object-oriented programming. Pandas is an awesome powerful python package for data manipulation and supports various functions to load and import data from various formats. Here we are covering how to deal with common issues in importing CSV file.
Table of Contents

Install and Load Pandas Package
Make sure you have pandas package already installed on your system. If you set up python using Anaconda, it comes with pandas package so you don't need to install it again. Otherwise you can install it by using command pip install pandas. Next step is to load the package by running the following command. pd is an alias of pandas package. We will use it instead of full name "pandas".
import pandas as pd
Create Sample Data for Import
The program below creates a sample pandas dataframe which can be used further for demonstration.

dt = {'ID': [11, 12, 13, 14, 15],
'first_name': ['David', 'Jamie', 'Steve', 'Stevart', 'John'],
'company': ['Aon', 'TCS', 'Google', 'RBS', '.'],
'salary': [74, 76, 96, 71, 78]}
mydt = pd.DataFrame(dt, columns = ['ID', 'first_name', 'company', 'salary'])
The sample data looks like below -

ID first_name company salary
0 11 David Aon 74
1 12 Jamie TCS 76
2 13 Steve Google 96
3 14 Stevart RBS 71
4 15 John . 78
Save data as CSV in the working directory
Check working directory before you save your datafile.

import os
os.getcwd()
Incase you want to change the working directory, you can specify it in under os.chdir( ) function. Single backslash does not work in Python so use 2 backslashes while specifying file location.

os.chdir("C:\\Users\\DELL\\Documents\\")
The following command tells python to write data in CSV format in your working directory.

mydt.to_csv('workingfile.csv', index=False)

Example 1 : Read CSV file with header row

It's the basic syntax of read_csv() function. You just need to mention the filename. It assumes you have column names in first row of your CSV file.

mydata = pd.read_csv("workingfile.csv")
It stores the data the way It should be as we have headers in the first row of our datafile. It is important to highlight that header=0 is the default value. Hence we don't need to mention the header= parameter. It means header starts from first row as indexing in python starts from 0. The above code is equivalent to this line of code. pd.read_csv("workingfile.csv", header=0)
Inspect data after importing

mydata.shape
mydata.columns
mydata.dtypes
It returns 5 number of rows and 4 number of columns. Column Names are ['ID', 'first_name', 'company', 'salary']

See the column types of data we imported. first_name and company are character variables. Remaining variables are numeric ones.


ID int64
first_name object
company object
salary int64

Example 2 : Read CSV file with header in second row

Suppose you have column or variable names in second row. To read this kind of CSV file, you can submit the following command.
mydata = pd.read_csv("workingfile.csv", header = 1)
header=1 tells python to pick header from second row. It's setting second row as header. It's not a realistic example. I just used it for illustration so that you get an idea how to solve it. To make it practical, you can add random values in first row in CSV file and then import it again.

11 David Aon 74
0 12 Jamie TCS 76
1 13 Steve Google 96
2 14 Stevart RBS 71
3 15 John . 78
Define your own column names instead of header row from CSV file

mydata0 = pd.read_csv("workingfile.csv", skiprows=1, names=['CustID', 'Name', 'Companies', 'Income'])
skiprows = 1 means we are ignoring first row and names= option is used to assign variable names manually.

CustID Name Companies Income
0 11 David Aon 74
1 12 Jamie TCS 76
2 13 Steve Google 96
3 14 Stevart RBS 71
4 15 John . 78
READ MORE »

ListenData: Matplotlib Tutorial – Learn Plotting in Python in 3 hours

$
0
0
This tutorial outlines how to perform plotting and data visualization in python using Matplotlib library. The objective of this post is to get you familiar with the basics and advanced plotting functions of the library. It contains several examples which will give you hands-on experience in generating plots in python.
Table of Contents

What is Matplotlib?

It is a powerful python library for creating graphics or charts. It takes care of all of your basic and advanced plotting requirements in Python. It took inspiration from MATLAB programming language and provides a similar MATLAB like interface for graphics. The beauty of this library is that it integrates well with pandas package which is used for data manipulation. With the combination of these two libraries, you can easily perform data wrangling along with visualization and get valuable insights out of data. Like ggplot2 library in R, matplotlib library is the grammar of graphics in Python and most used library for charts in Python.
visualization python

Basics of Matplotlib

First step you need to install and load matplotlib library. It must be already installed if you used Anaconda for setting up Python environment.
Install library
If matplotlib is not already installed, you can install it by using the command
pip install matplotlib
Import / Load Library
We will import Matplotlib’s Pyplot module and used alias or short-form as plt
from matplotlib import pyplot as plt
Elements of Graph
Different elements or parts of a standard graph are shown in the image below -
basics of plot
Figure
You can think of the figure as a big graph consisting of multiple sub-plots. Sub-plot can be one or more than one on a figure. In graphics world, it is called 'canvas'.
figure vs axes
Axes
You can call them 'sub-plots'.
Axis
It's the same thing (x or y-axis) which you studied in school or college. A standard graph shows the marks on the axis. In matplotlib library, it is called ticks and text or value in ticks is called ticklabels.
Basic Plot
x = [1, 2, 3, 4, 5]
y = [5, 7, 3, 8, 4]
plt.bar(x,y)
plt.show()
bar plot python
If you are using Jupyter Notebook, you can submit this command %matplotlib inline once to display or show plots automatically without need to enter plt.show() after generation of each plot.

Functions used for different types of plots

The following tables explain different graphs along with functions defined for these graphs in matplotlib library.
Type of PlotFunction
line plot (Default)plt.plot(  )
vertical bar plotsplt.bar(  )
horizontal bar plotsplt.barh(  )
histogramplt.hist(  )
boxplotplt.box(  )
area plotsplt.area(  )
scatter plotsplt.scatter(  )
pie plotsplt.pie(  )
hexagonal bin plotsplt.hexbin(  )
READ MORE »

ListenData: How to drop one or more columns in Pandas Dataframe

$
0
0
In this tutorial, we will cover how to drop or remove one or multiple columns from pandas dataframe.
What is pandas in Python?
pandas is a python package for data manipulation. It has several functions for the following data tasks:
  1. Drop or Keep rows and columns
  2. Aggregate data by one or more columns
  3. Sort or reorder data
  4. Merge or append multiple dataframes
  5. String Functions to handle text data
  6. DateTime Functions to handle date or time format columns
drop columns python
Import or Load Pandas library
To make use of any python library, we first need to load them up by using import command.
import pandas as pd
import numpy as np
Let's create a fake dataframe for illustration
The code below creates 4 columns named A through D.
df = pd.DataFrame(np.random.randn(6, 4), columns=list('ABCD'))
          A         B         C         D
0 -1.236438 -1.656038 1.655995 -1.413243
1 0.507747 0.710933 -1.335381 0.832619
2 0.280036 -0.411327 0.098119 0.768447
3 0.858730 -0.093217 1.077528 0.196891
4 -0.905991 0.302687 0.125881 -0.665159
5 -2.012745 -0.692847 -1.463154 -0.707779

Drop a column in python

In pandas, drop( ) function is used to remove column(s).axis=1 tells Python that you want to apply function on columns instead of rows.
df.drop(['A'], axis=1)
Column A has been removed. See the output shown below.
          B         C         D
0 -1.656038 1.655995 -1.413243
1 0.710933 -1.335381 0.832619
2 -0.411327 0.098119 0.768447
3 -0.093217 1.077528 0.196891
4 0.302687 0.125881 -0.665159
5 -0.692847 -1.463154 -0.707779
In order to create a new dataframenewdf storing remaining columns, you can use the command below.
newdf = df.drop(['A'], axis=1)
To delete the column permanently from original dataframe df, you can use the option inplace=True
df.drop(['A'], axis=1, inplace=True)
#Check columns in df after dropping column A
df.columns

Output
Index(['B', 'C', 'D'], dtype='object')
The parameter inplace= can be deprecated (removed) in future which means you might not see it working in the upcoming release of pandas package. You should avoid using this parameter if you are not already habitual of using it. Instead you can store your data after removing columns in a new dataframe (as explained in the above section).

If you want to change the existing dataframe, try this df = df.drop(['A'], axis=1)

Remove Multiple Columns in Python

You can specify all the columns you want to remove in a list and pass it in drop( ) function.
Method I
df2 = df.drop(['B','C'], axis=1)
Method II
cols = ['B','C']
df2 = df.drop(cols, axis=1)
Select or Keep Columns
If you wish to select a column (instead of drop), you can use the command
df['A']
To select multiple columns, you can submit the following code.
df[['A','B']]

How to drop column by position number from pandas Dataframe?

You can find out name of first column by using this command df.columns[0]. Indexing in python starts from 0.
df.drop(df.columns[0], axis =1)
To drop multiple columns by position (first and third columns), you can specify the position in list [0,2].
cols = [0,2]
df.drop(df.columns[cols], axis =1)

Drop columns by name pattern

df = pd.DataFrame({"X1":range(1,6),"X_2":range(2,7),"YX":range(3,8),"Y_1":range(2,7),"Z":range(5,10)})
   X1  X_2  YX  Y_1  Z
0 1 2 3 2 5
1 2 3 4 3 6
2 3 4 5 4 7
3 4 5 6 5 8
4 5 6 7 6 9

Drop column whose name starts with letter 'X'

df.loc[:,~df.columns.str.contains('^X')]
How it works?
  1. ^X is a expression of regex language which refers to beginning of letter 'X'
  2. df.columns.str.contains('^X') returns array [True, True, False, False, False].
    True where condition meets. Otherwise False
  3. Sign ~ refers to negate the condition.
  4. df.loc[ ] is used to select columns
It can also be written like :
df.drop(df.columns[df.columns.str.contains('^X')], axis=1)
Other Examples
#Removing columns whose name contains string 'X'
df.loc[:,~df.columns.str.contains('X')]

#Removing columns whose name contains string either 'X' or 'Y'
df.loc[:,~df.columns.str.contains('X|Y')]

#Removing columns whose name ends with string 'X'
df.loc[:,~df.columns.str.contains('X$')]

Drop columns where percentage of missing values is greater than 50%

df = pd.DataFrame({'A':[1,3,np.nan,5,np.nan],
'B':[4,np.nan,np.nan,5,np.nan]
})
% of missing values can be calculated by mean of NAs in each column.
cols = df.columns[df.isnull().mean()>0.5]
df.drop(cols, axis=1)

ListenData: Python : Complete Guide to Date and Time Functions

$
0
0
In this tutorial, we will cover python datetime module and how it is used to handle date, time and datetime formatted columns (variables). It includes various practical examples which would help you to gain confidence in dealing dates and times with python functions. In general, Date types columns are not easy to manipulate as it comes with a lot of challenges like dealing with leap years, different number of days in a month, different date and time formats or if date values are stored in string (character) format etc.
Table of Contents

Introduction : datetime module

It is a python module which provides several functions for dealing with dates and time. It has four classes as follows which are explained in the latter part of this article how these classes work.
  1. datetime
  2. date
  3. time
  4. timedelta
datetime python with examples

People who have no experience of working with real-world datasets might have not encountered date columns. They might be under impression that working with dates is rarely used and not so important. To enlighten them, I have listed down real-world examples wherein using datetime module can be beneficial.

  1. Selecting all the saving account holders who were active on 30th June, 2018 and checking their status whether they are still active
  2. Identifying insureds who filed more than 20 claims in the last 3 months
  3. Identifying customers who made multiple transactions in the last 6 months
  4. Extracting dates from timestamp values
Import datetime module
You can import or load datetime module by using the command below -
import datetime
You don't need to install this module as it comes bundled with the installation of python software.

Dates

Here we are using datetime.date class which is used to represent calendar date values. today() method is used to fetch current date.
datetime.date.today()

Output
datetime.date(2019, 7, 19)
In order to display it like a proper calendar date, we can wrap it within print( ) command.

print(datetime.date.today())

Output
2019-07-19
READ MORE »

ListenData: Python Dictionary Comprehension with Examples

$
0
0
In this tutorial, we will cover how dictionary comprehension works in Python. It includes various examples which would help you to learn the concept of dictionary comprehension and how it is used in real-world scenarios.
What is Dictionary?
Dictionary is a data structure in python which is used to store data such that values are connected to their related key. Roughly it works very similar to SQL tables or data stored in statistical softwares. It has two main components -
  1. Keys : Think about columns in tables. It must be unique (like column names cannot be duplicate)
  2. Values : It is similar to rows in tables. It can be duplicate.
It is defined in curly braces { }. Each key is followed by a colon (:) and then values.
Syntax of Dictionary

d = {'a': [1,2], 'b': [3,4], 'c': [5,6]}
To extract keys, values and structure of dictionary, you can submit the following commands.

d.keys() # 'a', 'b', 'c'
d.values() # [1, 2], [3, 4], [5, 6]
d.items()
Like R or SAS, you can create dataframe or dataset using pandas package in python.

import pandas as pd
pd.DataFrame(data=d)

a b c
0 1 3 5
1 2 4 6

What is Dictionary Comprehension?

Like List Comprehension, Dictionary Comprehension lets us to run for loop on dictionary with a single line of code.

Both list and dictionary comprehension are a part of functional programming which aims to make coding more readable and create list and dictionary in a crisp way without explicitly using for loop.

The difference between list and dictionary comprehension is that list comprehension creates list. Whereas dictionary comprehension creates dictionary. Syntax is also slightly different (refer the succeeding section). List is defined with square bracket [ ] whereas dictionary is created with { }

Syntax of Dictionary Comprehension

{key: value for (key, value) in iterable}
Iterable is any python object in which you can loop over. For example, list, tuple or string.

keys = ['a', 'b', 'c']
values = [1, 2, 3]
{i:j for (i,j) in zip(keys, values)}
It creates dictionary {'a': 1, 'b': 2, 'c': 3}. It can also be written without dictionary comprehension like dict(zip(keys, values)).

You can also execute dictionary comprehension with just defining only one variable i. In the example below, we are taking square of i for assigning values in dictionary.

range(5) returns 0 through 4 as indexing in python starts from 0 and excluding end point. If you want to know how dictionary comprehension is different from For Loop, refer the table below.

Dictionary Comprehension

d = {i:i**2 for i in range(5)}
For Loop

d = {}
for i in range(5):
d[i]=i**2
print(d)

Output
{0: 0, 1: 1, 2: 4, 3: 9, 4: 16}

d.keys() returns [0, 1, 2, 3, 4]
d.values() returns [0, 1, 4, 9, 16]
READ MORE »

ListenData: Python list comprehension with Examples

$
0
0
This tutorial covers how list comprehension works in Python. It includes many examples which would help you to familiarize the concept and you should be able to implement it in your live project at the end of this lesson.
Table of Contents

What is list comprehension?

Python is an object oriented programming language. Almost everything in them is treated consistently as an object. Python also features functional programming which is very similar to mathematical way of approaching problem where you assign inputs in a function and you get the same output with same input value. Given a function f(x) = x2, f(x) will always return the same result with the same x value. The function has no "side-effect" which means an operation has no effect on a variable/object that is outside the intended usage. "Side-effect" refers to leaks in your code which can modify a mutable data structure or variable.

Functional programming is also good for parallel computing as there is no shared data or access to the same variable.

List comprehension is a part of functional programming which provides a crisp way to create lists without writing a for loop.
list comprehension python
In the image above, the for clause iterates through each item of list. if clause filters list and returns only those items where filter condition meets. if clause is optional so you can ignore it if you don't have conditional statement.

[i**3 for i in [1,2,3,4] if i>2] means take item one by one from list [1,2,3,4] iteratively and then check if it is greater than 2. If yes, it takes cube of it. Otherwise ignore the value if it is less than or equal to 2. Later it creates a list of cube of values 3 and 4. Output : [27, 64]

List Comprehension vs. For Loop vs. Lambda + map()

All these three have different programming styles of iterating through each element of list but they serve the same purpose or return the same output. There are some differences between them as shown below.
1. List comprehension is more readable than For Loop and Lambda function.
List Comprehension

[i**2 for i in range(2,10)]
For Loop

sqr = []
for i in range(2,10):
sqr.append(i**2)
sqr
Lambda + Map

list(map(lambda i: i**2, range(2, 10)))

Output
[4, 9, 16, 25, 36, 49, 64, 81]
List comprehension is performing a loop operation and then combines items to a list in just a single line of code. It is more understandable and clearer than for loop and lambda.

range(2,10) returns 2 through 9 (excluding 10).

**2 refers to square (number raised to power of 2). sqr = [] creates empty list. append( ) function stores output of each repetition of sequence (i.e. square value) in for loop.

map( ) applies the lambda function to each item of iterable (list). Wrap it in list( ) to generate list as output

READ MORE »

PSF GSoC students blogs: Week 9: Weekly Check-In (#5)

$
0
0

1. What did you do this week?

A lot of different stuff:

- Introduced some small tests to make sure the multitaper and stockwell functions do what they should to.
- Made tfr_stockwell catch up with tfr_morlet and tfr_multitaper.
- Pushed a smaller PR that gives the user an option to return SourceEstimates data as kernelized (i.e. memory saving).
- Made tfr_multitaper and tfr_morlet take lists and generators as input, a crucial further step that allows the Inter-Trial-Coherence to be calcualted (how good this works remains to be checked, however).

2. What is coming up next?

We'll need to see how good the IRT stuff works and finish all of it. When everythings done, the core stuff of this GSoC project will be finished. This will involve pushing a quite big chuck of code, reviewing and correcting it. Then I'll make sure the same stuff works for tfr_stockwell as well. Finally I might start this week with the implementation of the last functional aspect, which is plotting the data.

3. Did you get stuck anywhere?

Yes. When introducing lists into tfr functions, the perfect solution would have been to process each "epoch" or element of the list subsequently, in order to save data. After trying to implement this (and getting it to work for tfr_morlet), I found out that if this was to be done cleany and working for all functions, it would require a huge recstructuring of the tfr_functions, that might have grave consequences for other aspects, e.g. parallel computing of the functions. Therefore I had to start of with a bit of a poorer solution, where the data is simply concatenated together at the start of the function, and then treated very much like epochs data. This will increase memory usage. However, I hope that I can implement a memory saving solution at some later point.

PSF GSoC students blogs: Week 9 Chek-in

$
0
0

What did you do this week?

Submitting of Clustering GUI and rectangular ROI, tests writing. All tests and cheks for Clustering GUI have passed. 

What is coming up next?

Documentation writing.

Did you get stuck anywhere?

Not yet.


Catalin George Festila: Python 3.7.3 : Using the flask - part 004.

$
0
0
The goal of this tutorial is to interact with the database in order to use it with flask_sqlalchemy python module. The db.Model is used to interact with the database. A database doesn't need a primary key but if you using the flask-sqlalchemy you need to have it for each one table in order to connect it. Let's see the database: C:\Python373\my_flask>python Python 3.7.3 (v3.7.3:ef4ec6ed12, Mar 25

IslandT: Use Blockchain API to retrieve the Bitcoin exchange rate within the 15 minutes period of the time

$
0
0

Hello and welcome back, in this article we will continue to develop the cryptocurrency application. In the previous few chapters, we had only used the cryptocompare API to make the REST call but in this chapter, we will add in the blockchain package which has the exchangerates module that we can use to retrieve the 15 minutes period of the time of the Bitcoin / major world currencies pair exchange rate. Since we will load the data from blockchain once the user has pressed the load button, we can now safely ignore the data from the previous cryptocompare rest call.

At the beginning of the program we will import the exchangerates module as well as get the ticker object from blockchain (rest call).

from blockchain import exchangerates
try:
    ticker = exchangerates.get_ticker() # get the ticker object from blockchain
except:
    print("An exception occurred")

Next, we will comment out the line to use the cryptocampare data under the get_exchange_rate method and add in a few lines of code to use the blockchain market data.

    for key, value in exchange_rate_s.items():  # populate exchange rate string and the currency tuple
        #sell_buy += base_crypto + ":" + key + "  " + str(value) + "\n"
        curr1 += (key,)
sell_buy += "Bitcoin : Currency price every 15 minute:" + "\n\n"
    # print the 15 min price for every bitcoin/currency
    for k in ticker:
        sell_buy += "BTC:" + str(k) + " " + str(ticker[k].p15min) + "\n"

If we load the data we will see the below outcome.

BTCOIN VS WORLD CURRENCIES PRICE

If you want to see the entire source code then please go back to the previous chapter to read them.

Are you a developer or a python programmer? Join mine private chat room through this link to see what am I working on right now.

Stack Abuse: Python for NLP: Movie Sentiment Analysis using Deep Learning in Keras

$
0
0

This is the 17th article in my series of articles on Python for NLP. In the last article, we started our discussion about deep learning for natural language processing.

The previous article was focused primarily towards word embeddings, where we saw how the word embeddings can be used to convert text to a corresponding dense vector, which can be subsequently used as input to any deep learning model. We perform basic classification task using word embeddings. We used custom dataset that contained 16 imaginary reviews about movies. Furthermore, the classification algorithms were trained and tested on same data. Finally, we only used a densely connected neural network to test our algorithm.

In this article, we will build upon the concepts that we studied in the previous article and will see classification in more detail using a real-world dataset. We will use three different types of deep neural networks: Densely connected neural network (Basic Neural Network), Convolutional Neural Network (CNN) and Long Short Term Memory Network (LSTM), which is a variant of Recurrent Neural Networks. Furthermore, we will see how to evaluate deep learning model on a totally unseen data.

Note: This article uses Keras Embedding Layer and GloVe word embeddings to convert text to numeric form. It is important that you already understand these concepts. Else, you should read my previous article and then you can come back and continue with this article.

The Dataset

The dataset that can be downloaded from this Kaggle link.

If you download the dataset and extract the compressed file, you will see a CSV file. The file contains 50,000 records and two columns: review and sentiment. The review column contains text for the review and the sentiment column contains sentiment for the review. The sentiment column can have two values i.e. "positive" and "negative" which makes our problem a binary classification problem.

Importing Required Libraries

The following script imports the required libraries:

import pandas as pd
import numpy as np
import re
import nltk
from nltk.corpus import stopwords

from numpy import array
from keras.preprocessing.text import one_hot
from keras.preprocessing.sequence import pad_sequences
from keras.models import Sequential
from keras.layers.core import Activation, Dropout, Dense
from keras.layers import Flatten
from keras.layers import GlobalMaxPooling1D
from keras.layers.embeddings import Embedding
from sklearn.model_selection import train_test_split
from keras.preprocessing.text import Tokenizer

Importing and Analysing the Dataset

Let's now import and analyze our dataset. Execute the following script:

movie_reviews = pd.read_csv("E:\Datasets\IMDB Dataset.csv")

movie_reviews.isnull().values.any()

movie_reviews.shape

In the script above we use the read_csv() method of the pandas library to read the CSV file containing our dataset. In the next line, we check if the dataset contains any NULL value or not. Finally, we print the shape of our dataset.

Let's now print the first 5 rows of the dataset using the head() method.

movie_reviews.head()

In the output, you will see the following dataframe:

head

Let's now take a look at any one of the reviews so that we have an idea about the text that we are going to process. Look at the following script.

movie_reviews["review"][3]

You should see the following review:

"Basically there's a family where a little boy (Jake) thinks there's a zombie in his closet & his parents are fighting all the time.<br /><br />This movie is slower than a soap opera... and suddenly, Jake decides to become Rambo and kill the zombie.<br /><br />OK, first of all when you're going to make a film you must Decide if its a thriller or a drama! As a drama the movie is watchable. Parents are divorcing & arguing like in real life. And then we have Jake with his closet which totally ruins all the film! I expected to see a BOOGEYMAN similar movie, and instead i watched a drama with some meaningless thriller spots.<br /><br />3 out of 10 just for the well playing parents & descent dialogs. As for the shots with Jake: just ignore them."

You can see that our text contains punctuations, brackets, and a few HTML tags as well. We will preprocess this text in the next section.

Finally, let's see the distribution of positive and negative sentiments in our dataset.

import seaborn as sns

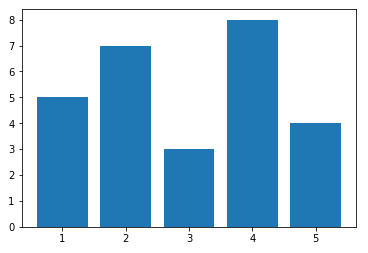
sns.countplot(x='sentiment', data=movie_reviews)

Output:

sentiment_distribution

From the output, it is clear that the dataset contains equal number of positive and negative reviews

Data Preprocessing

We saw that our dataset contained punctuations and HTML tags. In this section we will define a function that takes a text string as a parameter and then performs preprocessing on the string to remove special characters and HTML tags from the string. Finally, the string is returned to the calling function. Look at the following script:

def preprocess_text(sen):
    # Removing html tags
    sentence = remove_tags(sen)

    # Remove punctuations and numbers
    sentence = re.sub('[^a-zA-Z]', ' ', sentence)

    # Single character removal
    sentence = re.sub(r"\s+[a-zA-Z]\s+", ' ', sentence)

    # Removing multiple spaces
    sentence = re.sub(r'\s+', ' ', sentence)

    return sentence
TAG_RE = re.compile(r'<[^>]+>')

def remove_tags(text):
    return TAG_RE.sub('', text)

In the preprocess_text() method the first step is to remove the HTML tags. To remove the HTML tags, remove_tags() function has been defined. The remove_tags function simply replaces anything between opening and closing <> with an empty space.

Next, in the preprocess_text function, everything is removed except capital and small English letters, which results in single characters that make no sense. For instance, when you remove apostrophe from the word "Mark's", the apostrophe is replaced by an empty space. Hence, we are left with single character "s".

Next, we rempve all the single characters and replace it by a space which creates multiple spaces in our text. Finally, we remove the multiple spaces from our text as well.

Next, we will preprocess our reviews and will store them in a new list as shown below:

X = []
sentences = list(movie_reviews['review'])
for sen in sentences:
    X.append(preprocess_text(sen))

Let's now again see the fourth review:

X[3]

The output looks like this:

'Basically there a family where little boy Jake thinks there a zombie in his closet his parents are fighting all the time This movie is slower than soap opera and suddenly Jake decides to become Rambo and kill the zombie OK first of all when you re going to make film you must Decide if its thriller or drama As drama the movie is watchable Parents are divorcing arguing like in real life And then we have Jake with his closet which totally ruins all the film expected to see BOOGEYMAN similar movie and instead watched drama with some meaningless thriller spots out of just for the well playing parents descent dialogs As for the shots with Jake just ignore them '

From the output, you can see that the HTML tags, punctuations and numbers have been removed. We are only left with the alphabets.

Next, we need to convert our labels into digits. Since we only have two labels in the output i.e. "positive" and "negative". We can simply convert them into integers by replacing "positive" with digit 1 and negative with digit 0 as shown below:

y = movie_reviews['sentiment']

y = np.array(list(map(lambda x: 1 if x=="positive" else 0, y)))

Finally, we need to divide our dataset into train and test sets. The train set will be used to train our deep learning models while the test set will be used to evaluate how well our model performs.

We can use train_test_split method from the sklearn.model.selection module, as shown below:

X_train, X_test, y_train, y_test = train_test_split(X, y, test_size=0.20, random_state=42)

The script above divides our data into 80% for the training set and 20% for the testing set.

Let's now write the script for our embedding layer. The embedding layer converts our textual data into numeric data and is used as the first layer for the deep learning models in Keras.

Preparing the Embedding Layer

As a first step, we will use the Tokenizer class from the keras.preprocessing.text module to create a word-to-index dictionary. In the word-to-index dictionary, each word in the corpus is used as a key, while a corresponding unique index is used as the value for the key. Execute the following script:

tokenizer = Tokenizer(num_words=5000)
tokenizer.fit_on_texts(X_train)

X_train = tokenizer.texts_to_sequences(X_train)
X_test = tokenizer.texts_to_sequences(X_test)

If you view the X_train variable in variable explorer, you will see that it contains 40,000 lists where each list contains integers. Each list actually corresponds to each sentence in the training set. You will also notice that the size of each list is different. This is because sentences have different lengths.

We set the maximum size of each list to 100. You can try a differnt size. The lists with size greater than 100 will be truncated to 100. For the lists that have length less than 100, we will add 0 at the end of the list until it reaches the max length. This process is called padding.

The following script finds the vocabulary size and then perform padding on both train and test set.

# Adding 1 because of reserved 0 index
vocab_size = len(tokenizer.word_index) + 1

maxlen = 100

X_train = pad_sequences(X_train, padding='post', maxlen=maxlen)
X_test = pad_sequences(X_test, padding='post', maxlen=maxlen)

Now if you view the X_train or X_test, you will see that all the lists have same length i.e. 100. Also, the vocabulary_size variable now contains a value 92547 which means that our corpus has 92547 unique words.

We will use GloVe embeddings to create our feature matrix. In the following script we load the GloVe word embeddings and create a dictionary that will contain words as keys and their corresponding embedding list as values.

from numpy import array
from numpy import asarray
from numpy import zeros

embeddings_dictionary = dict()
glove_file = open('E:/Datasets/Word Embeddings/glove.6B.100d.txt', encoding="utf8")

for line in glove_file:
    records = line.split()
    word = records[0]
    vector_dimensions = asarray(records[1:], dtype='float32')
    embeddings_dictionary [word] = vector_dimensions
glove_file.close()

Finally, we will create an embedding matrix where each row number will correspond to the index of the word in the corpus. The matrix will have 100 columns where each column will contain the GloVe word embeddings for the words in our corpus.

embedding_matrix = zeros((vocab_size, 100))
for word, index in tokenizer.word_index.items():
    embedding_vector = embeddings_dictionary.get(word)
    if embedding_vector is not None:
        embedding_matrix[index] = embedding_vector

Once you execute the above script, you will see that embedding_matrix will contain 92547 rows (one for each word in the corpus). Now we are ready to create our deep learning models.

Text Classification with Simple Neural Network

The first deep learning model that we are going to develop is a simple deep neural network. Look at the following script:

model = Sequential()
embedding_layer = Embedding(vocab_size, 100, weights=[embedding_matrix], input_length=maxlen , trainable=False)
model.add(embedding_layer)

model.add(Flatten())
model.add(Dense(1, activation='sigmoid'))

In the script above, we create a Sequential() model. Next, we create our embedding layer. The embedding layer will have an input length of 100, the output vector dimension will also be 100. The vocabulary size will be 92547 words. Since we are not training our own embeddings and using the GloVe embedding, we set trainable to False and in the weights attribute we pass our own embedding matrix.

The embedding layer is then added to our model. Next, since we are directly connecting our embedding layer to densely connected layer, we flatten the embedding layer. Finally, we add a dense layer with sigmoid activation function.

To compile our model, we will use the adam optimizer, binary_crossentropy as our loss function and accuracy as metrics and then we will print the summary of our model:

model.compile(optimizer='adam', loss='binary_crossentropy', metrics=['acc'])

print(model.summary())

The output looks like this:

Layer (type)                 Output Shape              Param #
=================================================================
embedding_1 (Embedding)      (None, 100, 100)          9254700
_________________________________________________________________
flatten_1 (Flatten)          (None, 10000)             0
_________________________________________________________________
dense_1 (Dense)              (None, 1)                 10001
=================================================================
Total params: 9,264,701
Trainable params: 10,001
Non-trainable params: 9,254,700

Since there are 92547 words in our corpus and each word is represented as a 100-dimensional vector, the number of trainable parameter will be 92547x100 in the embedding layer. In the flattening layer, we simply multiply rows and column. Finally in the dense layer the number of parameters are 10000 (from the flattening layer) and 1 for the bias parameter, for a total of 10001.

Let's now train our model:

history = model.fit(X_train, y_train, batch_size=128, epochs=6, verbose=1, validation_split=0.2)

In the scipt above, we use the fit method to train our neural network. Notice we are training on our train set only. The validation_split of 0.2 means that 20% of the training data is used to find the training accuracy of the algorithm.

At the end of the training, you will see that training accuracy is around 85.52%.

To evaluate the performance of the model, we can simply pass the test set to the evaluate method of our model.

score = model.evaluate(X_test, y_test, verbose=1)

To check the test accuracy and loss, execute the following script:

print("Test Score:", score[0])
print("Test Accuracy:", score[1])

Once you execute the above script, you will see that we get a test accuracy of 74.68%. Our training accuracy was 85.52%. This means that our model is overfitting on the training set. Overfitting occurs when your model performs better on the training set than the test set. Ideally, the performance difference between training and test sets should be minimum.

Let's try to plot the loss and accuracy differences for training and test sets. Execute the following script:

plt.title('model accuracy')
plt.ylabel('accuracy')
plt.xlabel('epoch')
plt.legend(['train','test'], loc='upper left')
plt.show()

plt.plot(history.history['loss'])
plt.plot(history.history['val_loss'])

plt.title('model loss')
plt.ylabel('loss')
plt.xlabel('epoch')
plt.legend(['train','test'], loc='upper left')
plt.show()

Output:

img1

You can clearly see the differences for loss and accuracy between the training and test sets.

Text Classification with a Convolutional Neural Network

Convolutional neural network is a type of network that is primarily used for 2D data classification, such as images. A convolutional network tries to find specific features in an image in the first layer. In the next layers, the initally detected features are joined together to form bigger features. In this way, the whole image is detected.

Convolutional neural networks have been found to work well with text data as well. Though text data is one-dimensional, we can use 1D convolutional neural networks to extract features from our data. To learn more about convolutional neural networks, please refer to this article.

Let's create a simple convolutional neural network with 1 convolutional layer and 1 pooling layer. Remember, the code up to the creation of the embedding layer will remain same, execute the following piece of code after you create the embedding layer:

model = Sequential()

embedding_layer = Embedding(vocab_size, 100, weights=[embedding_matrix], input_length=maxlen , trainable=False)
model.add(embedding_layer)

model.add(Conv1D(128, 5, activation='relu'))
model.add(GlobalMaxPooling1D())
model.add(Dense(1, activation='sigmoid'))
model.compile(optimizer='adam', loss='binary_crossentropy', metrics=['acc'])

In the above script we create a sequential model, followed by an embedding layer. This step is similar to what we had done earlier. Next, we create a one-dimensional convolutional layer with 128 features, or kernels. The kernel size is 5 and the activation function used is sigmoid. Next, we add a global max pooling layer to reduce feature size. Finally we add a dense layer with signmoid activation. The compilation process is the same as it was in the previous section.

Let's now see the summary of our model:

print(model.summary())
_________________________________________________________________
Layer (type)                 Output Shape              Param #
=================================================================
embedding_2 (Embedding)      (None, 100, 100)          9254700
_________________________________________________________________
conv1d_1 (Conv1D)            (None, 96, 128)           64128
_________________________________________________________________
global_max_pooling1d_1 (Glob (None, 128)               0
_________________________________________________________________
dense_2 (Dense)              (None, 1)                 129
=================================================================
Total params: 9,318,957
Trainable params: 64,257
Non-trainable params: 9,254,700

You can see that in the above case we don't need to flatten our embedding layer. You can also notice that feature size is now reduced using the pooling layer.

Let's now train our model and evaluate it on the training set. The process to train and test our model remains the same. To do so, we can use the fit and evaluate methods, respectively.

history = model.fit(X_train, y_train, batch_size=128, epochs=6, verbose=1, validation_split=0.2)

score = model.evaluate(X_test, y_test, verbose=1)

The following script prints the results:

print("Test Score:", score[0])
print("Test Accuracy:", score[1])

If you compare the training and test accuracy, you will see that the training accuracy for CNN will be around 92%, which is greater than the training accuracy of the simple neural network. The test accruacy is around 82% for the CNN, which is also greater than the test accuracy for the simple neural network, which was around 74%.

However our CNN model is still overfitting as there is a vast difference between the training and test accuracy. Let's plot the loss and accuracy difference between the training and test set.

import matplotlib.pyplot as plt

plt.plot(history.history['acc'])
plt.plot(history.history['val_acc'])

plt.title('model accuracy')
plt.ylabel('accuracy')
plt.xlabel('epoch')
plt.legend(['train','test'], loc = 'upper left')
plt.show()

plt.plot(history.history['loss'])
plt.plot(history.history['val_loss'])

plt.title('model loss')
plt.ylabel('loss')
plt.xlabel('epoch')
plt.legend(['train','test'], loc = 'upper left')
plt.show()

Output:

img2

You can clearly see the loss and accuracy differences between train and test sets.

Let's now train our third deep learning model, which is a recurrrent neural network, and see if we can get rid of the overfitting.

Text Classification with Recurrent Neural Network (LSTM)

Recurrent neural network is a type of neural networks that is proven to work well with sequence data. Since text is actually a sequence of words, a recurrent neural network is an automatic choice to solve text-related problems. In this section, we will use an LSTM (Long Short Term Memory network) which is a variant of RNN, to solve sentiment classification problem.

Once again, execute the code until the word embedding section and after that run the following piece of code.

model = Sequential()
embedding_layer = Embedding(vocab_size, 100, weights=[embedding_matrix], input_length=maxlen , trainable=False)
model.add(embedding_layer)
model.add(LSTM(128))

model.add(Dense(1, activation='sigmoid'))
model.compile(optimizer='adam', loss='binary_crossentropy', metrics=['acc'])

In the script above, we start by initializing a sequential model followed by the creation of the embedding layer. Next, we create an LSTM layer with 128 neurons (You can play around with number of neurons). The rest of the code is same as it was for the CNN.

Let's plot the summary of our model.

print(model.summary())

The model summary looks like this:

_________________________________________________________________
Layer (type)                 Output Shape              Param #
=================================================================
embedding_3 (Embedding)      (None, 100, 100)          9254700
_________________________________________________________________
lstm_1 (LSTM)                (None, 128)               117248
_________________________________________________________________
dense_3 (Dense)              (None, 1)                 129
=================================================================
Total params: 9,372,077
Trainable params: 117,377
Non-trainable params: 9,254,700

Our next step is to train the model on the training set and evaluate its performance on the test set.

history = model.fit(X_train, y_train, batch_size=128, epochs=6, verbose=1, validation_split=0.2)

score = model.evaluate(X_test, y_test, verbose=1)

The script above trains the model on the test set. The batch size is 128, whereas the number of epochs is 6. At the end of the training, you will see that the training accuracy is around 85.40%.

Once the model is trained, we can see the model results on test set with the following script:

print("Test Score:", score[0])
print("Test Accuracy:", score[1])

In the output, you will see that our test accuracy is around 85.04%. The test accuracy is better than both the CNN and densely connected neural network. Also, we can see that there is a very small difference between the training accuracy and test accuracy which means that our model is not overfitting.

Let's plot the loss and accuracy differences between training and test sets.

import matplotlib.pyplot as plt

plt.plot(history.history['acc'])
plt.plot(history.history['val_acc'])

plt.title('model accuracy')
plt.ylabel('accuracy')
plt.xlabel('epoch')
plt.legend(['train','test'], loc='upper left')
plt.show()

plt.plot(history.history['loss'])
plt.plot(history.history['val_loss'])

plt.title('model loss')
plt.ylabel('loss')
plt.xlabel('epoch')
plt.legend(['train','test'], loc='upper left')
plt.show()

Output:

img3

The output shows that the difference between the accuracy values for training and test sets is much smaller compared to the simple neural network and CNN. Similarly, the different between the loss values is also negligible, which shows that our model is not overfitting. We can conclude, that for our problem, RNN is the best algorithm.

In this article, we randomly chose the number of layers, neurons, hyper parameters, etc. I would suggest that you try to change the number of layers, number of neurons and activation functions for all three neural networks discussed in this article and see which neural network works best for you.

Making Predictions on Single Instance

This is the final section of the article and here we will see how to make predictions on a single instance or single sentiment. Let's retrieve any review from our corpus and then try to predict its sentiment.

Let's first randmoly select any review from our corpus:

instance = X[57]
print(instance)

Output:

I laughed all the way through this rotten movie It so unbelievable woman leaves her husband after many years of marriage has breakdown in front of real estate office What happens The office manager comes outside and offers her job Hilarious Next thing you know the two women are going at it Yep they re lesbians Nothing rings true in this Lifetime for Women with nothing better to do movie Clunky dialogue like don want to spend the rest of my life feeling like had chance to be happy and didn take it doesn help There a wealthy distant mother who disapproves of her daughter new relationship sassy black maid unbelievable that in the year film gets made in which there a sassy black maid Hattie McDaniel must be turning in her grave The woman has husband who freaks out and wants custody of the snotty teenage kids Sheesh No cliche is left unturned

You can clearly see that this is negative review. To predict the sentiment of this review, we have to convert this review into numeric form. We can do so using the tokenizer that we created in word embedding section. The text_to_sequences method will convert the sentence into its numeric counter part.

Next, we need to pad our input sequence as we did for our corpus. Finally, we can use the predict method of our model and pass it our processed input sequence. Look at the following code:

instance = tokenizer.texts_to_sequences(instance)

flat_list = []
for sublist in instance:
    for item in sublist:
        flat_list.append(item)

flat_list = [flat_list]

instance = pad_sequences(flat_list, padding='post', maxlen=maxlen)

model.predict(instance)

The output looks like this:

array([[0.3304276]], dtype=float32)

Remember, we mapped the positive outputs to 1 and the negative outputs to 0. However, the sigmoid function predicts floating value between 0 and 1. If the value is less than 0.5, the sentiment is considered negative where as if the value is greater than 0.5, the sentiment is considered as positive. The sentiment value for our single instance is 0.33 which means that our sentiment is predicted as negative, which actually is the case.

Conclusion

Text classification is one of the most common natural language processing tasks. In this article we saw how to perform sentiment analysis, which is a type of text classification using Keras deep learning library. We used three different types of neural networks to classify public sentiment about different movies. The results show that LSTM, which is a variant of RNN outperforms both the CNN and simple neural network.

PSF GSoC students blogs: Weekly Check-in #10 : ( 26 July - 1 Aug )

$
0
0

What did you do this week?

  • Improved performance of Protego by implementing lazy regex compilation.
  • Benchmark Results :
    • Time to parse 570 `robots.txt` files :
      • Protego : 

1th percentile : 2.7699876955011857e-05

2th percentile : 2.873970428481698e-05
3th percentile : 2.9699215374421325e-05
4th percentile : 3.224591899197549e-05
5th percentile : 4.687150139943696e-05
6th percentile : 4.99031925573945e-05
7th percentile : 5.1947773463325576e-05
8th percentile : 5.499204096850008e-05
9th percentile : 6.096377648646012e-05
10th percentile : 6.5171901951544e-05
11th percentile : 6.888137431815267e-05
12th percentile : 7.324356294702739e-05
13th percentile : 7.894828100688755e-05
14th percentile : 8.215024252422154e-05
15th percentile : 8.580444846302269e-05
16th percentile : 9.087424259632826e-05
17th percentile : 9.453515158384108e-05
18th percentile : 9.845275984844194e-05
19th percentile : 0.00010576953922281974
20th percentile : 0.00010908680269494655
21th percentile : 0.00011346521554514766
22th percentile : 0.00011745369003619999
23th percentile : 0.00012266511359484866
24th percentile : 0.00012934588245116173
25th percentile : 0.00013317775301402435
26th percentile : 0.00013812304299790413
27th percentile : 0.00014379713335074487
28th percentile : 0.0001478325633797795
29th percentile : 0.00015269142750184983
30th percentile : 0.00015583030326524747
31th percentile : 0.00016207747408770952
32th percentile : 0.00016814308764878663
33th percentile : 0.00017558263454702685
34th percentile : 0.0001791961200069636
35th percentile : 0.00018331664541619826
36th percentile : 0.00018782239814754578
37th percentile : 0.00020101146976230665
38th percentile : 0.00021080956066725777
39th percentile : 0.0002191616025811527
40th percentile : 0.00022313839581329382
41th percentile : 0.00023610091913724317
42th percentile : 0.00024202127999160437
43th percentile : 0.00025254306383430957
44th percentile : 0.0002613482432207093
45th percentile : 0.00027281629518256524
46th percentile : 0.0002825428586220369
47th percentile : 0.00029760556557448584
48th percentile : 0.0003045148315140978
49th percentile : 0.00031528359511867165
50th percentile : 0.00032863950764294714
51th percentile : 0.00033717566460836676
52th percentile : 0.0003416953643318266
53th percentile : 0.0003470732060668524
54th percentile : 0.0003669440594967458
55th percentile : 0.00038517144639627077
56th percentile : 0.00039296211674809465
57th percentile : 0.00040781671574222853
58th percentile : 0.00043915878282859913
59th percentile : 0.000452117950480897
60th percentile : 0.00046376979735214253
61th percentile : 0.00048657128820195784
62th percentile : 0.000499515812844038
63th percentile : 0.0005207062627596316
64th percentile : 0.0005299280432518572
65th percentile : 0.0005495497040101327
66th percentile : 0.0005685523769352586
67th percentile : 0.0006020385860756505
68th percentile : 0.0006274086365010591
69th percentile : 0.0006566531292628494
70th percentile : 0.0007076533991494216
71th percentile : 0.0007376162291620856
72th percentile : 0.0007838941627414898
73th percentile : 0.0008059043298999313
74th percentile : 0.0008355366264004261
75th percentile : 0.0008556070024496876
76th percentile : 0.0008868179540149867
77th percentile : 0.000923176541837165
78th percentile : 0.0009402975218836217
79th percentile : 0.0009615422626666264
80th percentile : 0.0010233349952613947
81th percentile : 0.0010754130978602918
82th percentile : 0.001147941672534216
83th percentile : 0.0012463560857577246
84th percentile : 0.001413288317853583
85th percentile : 0.0015500969457207241
86th percentile : 0.0016404926014365615
87th percentile : 0.0017601483988983078
88th percentile : 0.001990081521798858
89th percentile : 0.0020840425149071984
90th percentile : 0.00223695969616529
91th percentile : 0.0027382333615969395
92th percentile : 0.003209659400745295
93th percentile : 0.003413123589125463
94th percentile : 0.003614264693169389
95th percentile : 0.004199645197513741
96th percentile : 0.0050750740407966115
97th percentile : 0.006345603382505936
98th percentile : 0.010620926853735009
99th percentile : 0.014881028074014414
100th percentile : 0.3524162050016457
Total Time : 0.9671466191502986


  • Rerp :

1th percentile : 3.3354560291627424e-05
2th percentile : 3.713361686095595e-05
3th percentile : 3.977624670369551e-05
4th percentile : 4.1428642580285663e-05
5th percentile : 4.307620547479018e-05
6th percentile : 4.4297858257777984e-05
7th percentile : 4.512064464506693e-05
8th percentile : 4.62283578235656e-05
9th percentile : 4.7029419511090965e-05
10th percentile : 4.876619786955416e-05
11th percentile : 4.963505649357103e-05
12th percentile : 5.0573914777487516e-05
13th percentile : 5.245569904218428e-05
14th percentile : 5.371962324716151e-05
15th percentile : 5.537890974665061e-05
16th percentile : 5.693770886864513e-05
17th percentile : 5.856729010702111e-05
18th percentile : 6.054672674508765e-05
19th percentile : 6.271598846069537e-05
20th percentile : 6.435938994400204e-05
21th percentile : 6.516157212899999e-05
22th percentile : 6.650968367466703e-05
23th percentile : 6.859996399725787e-05
24th percentile : 7.051768887322396e-05
25th percentile : 7.182926128734834e-05
26th percentile : 7.280070130946115e-05
27th percentile : 7.516904719523155e-05
28th percentile : 7.721723872236908e-05
29th percentile : 7.916693721199407e-05
30th percentile : 8.108830224955453e-05
31th percentile : 8.232314066844993e-05
32th percentile : 8.376264129765332e-05
33th percentile : 8.683280975674279e-05
34th percentile : 8.873320126440376e-05
35th percentile : 9.271403978345914e-05
36th percentile : 9.530647774226963e-05
37th percentile : 9.612064211978578e-05
38th percentile : 9.923133737174794e-05
39th percentile : 0.00010171762463869526
40th percentile : 0.00010625979921314866
41th percentile : 0.00010816387701197526
42th percentile : 0.00011111118044937029
43th percentile : 0.00011296253709588199
44th percentile : 0.00011564508313313126
45th percentile : 0.00011762225112761372
46th percentile : 0.0001199327377253212
47th percentile : 0.00012206821076688357
48th percentile : 0.00012334560102317482
49th percentile : 0.0001241734232462477
50th percentile : 0.00012841200805269182
51th percentile : 0.00013063091028016062
52th percentile : 0.00013440016424283387
53th percentile : 0.00014038270091987215
54th percentile : 0.00014380343549419197
55th percentile : 0.00014670880555058832
56th percentile : 0.00015635559451766316
57th percentile : 0.00016003610391635448
58th percentile : 0.00016298036556690933
59th percentile : 0.0001672452301136218
60th percentile : 0.00017417840135749426
61th percentile : 0.0001789595956506673
62th percentile : 0.00018499216996133326
63th percentile : 0.000188468651031144
64th percentile : 0.00019886211899574848
65th percentile : 0.00020551880443235866
66th percentile : 0.00022067518526455387
67th percentile : 0.0002273203057120554
68th percentile : 0.00023220740375109019
69th percentile : 0.00023844652139814562
70th percentile : 0.0002453765002428554
71th percentile : 0.00025328055577119804
72th percentile : 0.00026494280027691277
73th percentile : 0.0002700907111284323
74th percentile : 0.0002776077447924763
75th percentile : 0.00028559749625856057
76th percentile : 0.0002939418895402923
77th percentile : 0.00030131636187434195
78th percentile : 0.0003126341974711977
79th percentile : 0.00033080284571042297
80th percentile : 0.00034691259788814947
81th percentile : 0.00035974163125501973
82th percentile : 0.0003756762132979929
83th percentile : 0.0003974944079527631
84th percentile : 0.00042601515655405804
85th percentile : 0.0004707767002400941
86th percentile : 0.0005226233176654204
87th percentile : 0.000593174379318952
88th percentile : 0.0006327448430238293
89th percentile : 0.0006763881914957895
90th percentile : 0.0007627901999512707
91th percentile : 0.0008925417115096933
92th percentile : 0.0009550850861705844
93th percentile : 0.0010451532586012076
94th percentile : 0.001192281488620211
95th percentile : 0.0014297207511845033
96th percentile : 0.0019635642785578978
97th percentile : 0.0028875880916893935
98th percentile : 0.003482828259293456
99th percentile : 0.005360185811587109
100th percentile : 0.10254244599491358
Total Time : 0.3250674139417242


  • Reppy :

1th percentile : 2.162361182854511e-05

2th percentile : 2.220256341388449e-05
3th percentile : 2.2752554214093836e-05
4th percentile : 2.3155876551754772e-05
5th percentile : 2.3345895169768482e-05
6th percentile : 2.3581279383506625e-05
7th percentile : 2.3800657218089327e-05
8th percentile : 2.404956554528326e-05
9th percentile : 2.4449775373796e-05
10th percentile : 2.4526998458895832e-05
11th percentile : 2.4734465550864116e-05
12th percentile : 2.501416311133653e-05
13th percentile : 2.5257256202166902e-05
14th percentile : 2.5508275430183856e-05
15th percentile : 2.5631794414948672e-05
16th percentile : 2.5838598376139998e-05
17th percentile : 2.602160981041379e-05
18th percentile : 2.623650012537837e-05
19th percentile : 2.657681339769624e-05
20th percentile : 2.684040227904916e-05
21th percentile : 2.697262083529495e-05
22th percentile : 2.7140517486259343e-05
23th percentile : 2.7374162309570236e-05
24th percentile : 2.7653762372210623e-05
25th percentile : 2.7893507649423555e-05
26th percentile : 2.8271443152334538e-05
27th percentile : 2.8522835636977104e-05
28th percentile : 2.86863191286102e-05
29th percentile : 2.9304152412805703e-05
30th percentile : 2.9605402960442007e-05
31th percentile : 3.017280323547311e-05
32th percentile : 3.0516989063471556e-05
33th percentile : 3.067093537538312e-05
34th percentile : 3.082565352087841e-05
35th percentile : 3.135309525532648e-05
36th percentile : 3.208859474398196e-05
37th percentile : 3.247583154006862e-05
38th percentile : 3.269435226684436e-05
39th percentile : 3.315690904855728e-05
40th percentile : 3.3400004031136636e-05
41th percentile : 3.3652212441666054e-05
42th percentile : 3.409066441236064e-05
43th percentile : 3.4653283073566854e-05
44th percentile : 3.496108751278371e-05
45th percentile : 3.541125479387119e-05
46th percentile : 3.5902504459954796e-05
47th percentile : 3.6276737810112535e-05
48th percentile : 3.6635485012084244e-05
49th percentile : 3.721281769685447e-05
50th percentile : 3.800999547820538e-05
51th percentile : 3.8442565855802965e-05
52th percentile : 3.906575555447489e-05
53th percentile : 3.9818558434490114e-05
54th percentile : 4.0259777160827075e-05
55th percentile : 4.081644947291352e-05
56th percentile : 4.164107725955546e-05
57th percentile : 4.2695973243098705e-05
58th percentile : 4.327721893787384e-05
59th percentile : 4.374971758807078e-05
60th percentile : 4.449379630386829e-05
61th percentile : 4.5256814191816366e-05
62th percentile : 4.648686212021857e-05
63th percentile : 4.725401813630016e-05
64th percentile : 4.7935123438946904e-05
65th percentile : 4.836860025534407e-05
66th percentile : 4.989190114429222e-05
67th percentile : 5.118637214764021e-05
68th percentile : 5.365979566704482e-05
69th percentile : 5.4940154514042646e-05
70th percentile : 5.6670801131986065e-05
71th percentile : 5.7810868456726885e-05
72th percentile : 5.967719771433622e-05
73th percentile : 6.090975672123022e-05
74th percentile : 6.22420568834059e-05
75th percentile : 6.363349530147389e-05
76th percentile : 6.62969145923853e-05
77th percentile : 6.771052634576335e-05
78th percentile : 7.119747810065746e-05
79th percentile : 7.25558859994635e-05
80th percentile : 7.555540942121297e-05
81th percentile : 7.721115180174822e-05
82th percentile : 8.040603686822577e-05
83th percentile : 8.449697430478408e-05
84th percentile : 9.136687905993307e-05
85th percentile : 0.00010001055125030689
86th percentile : 0.00010437953693326563
87th percentile : 0.00010966862348141146
88th percentile : 0.00011606903048232199
89th percentile : 0.00012904579183668834
90th percentile : 0.0001419753054506146
91th percentile : 0.00015910587011603618
92th percentile : 0.0001678877574158833
93th percentile : 0.00017075338342692703
94th percentile : 0.0001852879987563938
95th percentile : 0.00020929565725964468
96th percentile : 0.00024782420543488113
97th percentile : 0.00031401828702655606
98th percentile : 0.00042780365678481765
99th percentile : 0.0007196939954883392
100th percentile : 0.015718427996034734
Total Time : 0.056579587879241444 


  • Time to parse 570 `robots.txt` + answer 1000 queries :


  • Protego :

1th percentile : 0.00022642403651843777
2th percentile : 0.0002455927582923323
3th percentile : 0.0002700344115146436
4th percentile : 0.00030506656446959823
5th percentile : 0.0003361452043463942
6th percentile : 0.0006548141513485462
7th percentile : 0.006360510903614359
8th percentile : 0.007131148563930765
9th percentile : 0.007232025640987558
10th percentile : 0.0074764549004612485
11th percentile : 0.007567080038861605
12th percentile : 0.007597973360680044
13th percentile : 0.007742152503924444
14th percentile : 0.007885884823917878
15th percentile : 0.007974496956012444
16th percentile : 0.008038631718955002
17th percentile : 0.008147774269018554
18th percentile : 0.00825201678526355
19th percentile : 0.008290469885832864
20th percentile : 0.008407972805434838
21th percentile : 0.008563984115171478
22th percentile : 0.00865172116580652
23th percentile : 0.008827776664984414
24th percentile : 0.008914225480984896
25th percentile : 0.00903273249787162
26th percentile : 0.009198313207598403
27th percentile : 0.009300846062542407
28th percentile : 0.009369150482816623
29th percentile : 0.00949086661246838
30th percentile : 0.009662740393832792
31th percentile : 0.009733983783517032
32th percentile : 0.009879345322260633
33th percentile : 0.009950139950378798
34th percentile : 0.010088466620072723
35th percentile : 0.010197816550498829
36th percentile : 0.010436765641206876
37th percentile : 0.010514531028311467
38th percentile : 0.010665477194997948
39th percentile : 0.010827978859015276
40th percentile : 0.011002124400692993
41th percentile : 0.011148456159135095
42th percentile : 0.011368798832118046
43th percentile : 0.011487696073600092
44th percentile : 0.011707047436502763
45th percentile : 0.011912175754696365
46th percentile : 0.012091318586899434
47th percentile : 0.012403804728528485
48th percentile : 0.012615183840389364
49th percentile : 0.012862769518687856
50th percentile : 0.013217682506365236
51th percentile : 0.01340518798591802
52th percentile : 0.01352815491030924
53th percentile : 0.013966644167230697
54th percentile : 0.01409387657622574
55th percentile : 0.014233837000210772
56th percentile : 0.014521462006960074
57th percentile : 0.014781607153272487
58th percentile : 0.014995985809946433
59th percentile : 0.015296624085167422
60th percentile : 0.015527555000153369
61th percentile : 0.016045221478125316
62th percentile : 0.01659960769757162
63th percentile : 0.01676327614419279
64th percentile : 0.017174666239880027
65th percentile : 0.017490878998069094
66th percentile : 0.018423352434183474
67th percentile : 0.018841196583089186
68th percentile : 0.019116475115297363
69th percentile : 0.019446102704532675
70th percentile : 0.020057601494772814
71th percentile : 0.020354504112474386
72th percentile : 0.02097715399693698
73th percentile : 0.021880446499126266
74th percentile : 0.022401327792031224
75th percentile : 0.02387530775013147
76th percentile : 0.024389017039211466
77th percentile : 0.025418429958226626
78th percentile : 0.02612152078479994
79th percentile : 0.026991543267795355
80th percentile : 0.02725330880493858
81th percentile : 0.02819153038057266
82th percentile : 0.028743643603520466
83th percentile : 0.0291122830696986
84th percentile : 0.0302712766098557
85th percentile : 0.031311619499319925
86th percentile : 0.033147870173561376
87th percentile : 0.03562422185743344
88th percentile : 0.037943448512814976
89th percentile : 0.0410020513793279
90th percentile : 0.042467083205701785
91th percentile : 0.04385224552766885
92th percentile : 0.048461116199032414
93th percentile : 0.05124235297014821
94th percentile : 0.058124283020151796
95th percentile : 0.0656154660013271
96th percentile : 0.07349955087294804
97th percentile : 0.08536504748437401
98th percentile : 0.12181000921904347
99th percentile : 0.2565471519404662
100th percentile : 9.357566147999023
Total Time : 22.702531507180538


  • Rerp : 

1th percentile : 0.0002586155773315113
2th percentile : 0.0002680259020416997
3th percentile : 0.0002760141613543965
4th percentile : 0.00028079711890313777
5th percentile : 0.00028584394603967664
6th percentile : 0.0002953060937579721
7th percentile : 0.0003263016318669543
8th percentile : 0.0003399748430820182
9th percentile : 0.0003643145396199543
10th percentile : 0.0004243065923219547
11th percentile : 0.0005022531838039868
12th percentile : 0.0005811095540411771
13th percentile : 0.0007712837975122965
14th percentile : 0.0009081797840190134
15th percentile : 0.001198919896705774
16th percentile : 0.005556855280301534
17th percentile : 0.005620106659771409
18th percentile : 0.0056474076348240485
19th percentile : 0.005661155443522148
20th percentile : 0.005671675599296577
21th percentile : 0.00573249409921118
22th percentile : 0.005763994345616083
23th percentile : 0.005805671029957012
24th percentile : 0.005915698123862967
25th percentile : 0.005976552249194356
26th percentile : 0.006028217305720318
27th percentile : 0.0062242261035135036
28th percentile : 0.006343121677055025
29th percentile : 0.006424852644995552
30th percentile : 0.00667906229646178
31th percentile : 0.0067619663618097535
32th percentile : 0.0070060861244564876
33th percentile : 0.007157047429500381
34th percentile : 0.007403950598964003
35th percentile : 0.007744132106745382
36th percentile : 0.007954373717075214
37th percentile : 0.008109132457175292
38th percentile : 0.008344825979147572
39th percentile : 0.008511215844191612
40th percentile : 0.008826740406220779
41th percentile : 0.00906646743300371
42th percentile : 0.009274406279146207
43th percentile : 0.009515448211750481
44th percentile : 0.00983484452182893
45th percentile : 0.010087144296994666
46th percentile : 0.010295598614320625
47th percentile : 0.010480861906398787
48th percentile : 0.01091703855781816
49th percentile : 0.011159487174736568
50th percentile : 0.011772642006690148
51th percentile : 0.011986672398925294
52th percentile : 0.01279346747614909
53th percentile : 0.013135334684775443
54th percentile : 0.013611556301475505
55th percentile : 0.013922000140883031
56th percentile : 0.014666306916042232
57th percentile : 0.015381680679274722
58th percentile : 0.01589978834468638
59th percentile : 0.016374319497699616
60th percentile : 0.016734498599544168
61th percentile : 0.01752393709874013
62th percentile : 0.018182242423354183
63th percentile : 0.019074043160362646
64th percentile : 0.01997635372914374
65th percentile : 0.02079449999946519
66th percentile : 0.0217450829455629
67th percentile : 0.022928896843368428
68th percentile : 0.024045514639001345
69th percentile : 0.025837690729676968
70th percentile : 0.028897825501917364
71th percentile : 0.030988183070876363
72th percentile : 0.0331421113217948
73th percentile : 0.03540579502267065
74th percentile : 0.03750738176400774
75th percentile : 0.04153568974288646
76th percentile : 0.044738838808261794
77th percentile : 0.04617143327224767
78th percentile : 0.04797403665172169
79th percentile : 0.049303102822450456
80th percentile : 0.0519246932002716
81th percentile : 0.056523018498846805
82th percentile : 0.05932735565409529
83th percentile : 0.06491579046676632
84th percentile : 0.07405771620629815
85th percentile : 0.08099271040482561
86th percentile : 0.0827186224120669
87th percentile : 0.08814936124792419
88th percentile : 0.10215447843074807
89th percentile : 0.12347438907323528
90th percentile : 0.13262156090204377
91th percentile : 0.13784603927371789
92th percentile : 0.14106510871904904
93th percentile : 0.149746452138934
94th percentile : 0.1689057002816117
95th percentile : 0.1920064914062091
96th percentile : 0.20593821424059572
97th percentile : 0.23060317544499376
98th percentile : 0.2811765244387789
99th percentile : 0.32091369449568197
100th percentile : 35.01336312000058
Total Time : 68.263299744096


  • Reppy :

1th percentile : 0.0007841631540213711
2th percentile : 0.0007857630847138352
3th percentile : 0.0007895803487917873
4th percentile : 0.0007923451531678437
5th percentile : 0.0007937952512293122
6th percentile : 0.0007957545458339155
7th percentile : 0.0007994147652061656
8th percentile : 0.00080157391843386
9th percentile : 0.000803732747444883
10th percentile : 0.0008064137960900552
11th percentile : 0.0008074324003246147
12th percentile : 0.000810217279358767
13th percentile : 0.0008120309337391518
14th percentile : 0.0008143939625006168
15th percentile : 0.0008192333487386349
16th percentile : 0.0008216966793406755
17th percentile : 0.0008285224392602686
18th percentile : 0.0008306106651434675
19th percentile : 0.0008351552962267306
20th percentile : 0.000839995002024807
21th percentile : 0.0008470515010412783
22th percentile : 0.0008504057183745317
23th percentile : 0.0008562683935451787
24th percentile : 0.0008589595544617624
25th percentile : 0.0008615582482889295
26th percentile : 0.000865592900372576
27th percentile : 0.0008708581016981043
28th percentile : 0.0008743277180474252
29th percentile : 0.0008771004727168475
30th percentile : 0.000881145008315798
31th percentile : 0.0008864743681624532
32th percentile : 0.0008901747700292617
33th percentile : 0.000895084237708943
34th percentile : 0.0009022589604137465
35th percentile : 0.0009102831507334485
36th percentile : 0.000917858803877607
37th percentile : 0.0009238129240111448
38th percentile : 0.0009379683568840847
39th percentile : 0.0009428946045227349
40th percentile : 0.0009482089983066544
41th percentile : 0.0009552792130853049
42th percentile : 0.0009671382626402192
43th percentile : 0.0009730549648520536
44th percentile : 0.0009789519157493488
45th percentile : 0.0009844994521699846
46th percentile : 0.0009921077758190222
47th percentile : 0.0010005114547675476
48th percentile : 0.001008978757308796
49th percentile : 0.0010182190463820008
50th percentile : 0.001026069003273733
51th percentile : 0.0010328273047343827
52th percentile : 0.001036703673307784
53th percentile : 0.001043936902715359
54th percentile : 0.001051428477803711
55th percentile : 0.0010733767972851641
56th percentile : 0.0010824827261967586
57th percentile : 0.0010936163301812484
58th percentile : 0.0011024232968338767
59th percentile : 0.0011244768448523245
60th percentile : 0.0011356866045389323
61th percentile : 0.0011614860834379213
62th percentile : 0.0011811956216115503
63th percentile : 0.0011967952846316623
64th percentile : 0.0012244889623252676
65th percentile : 0.0012455579431843943
66th percentile : 0.0012709089784766548
67th percentile : 0.001316329047403997
68th percentile : 0.0013451251300284639
69th percentile : 0.0013541984985931776
70th percentile : 0.0013740782014792785
71th percentile : 0.0013971188431605697
72th percentile : 0.0014169599517481401
73th percentile : 0.001438646080350736
74th percentile : 0.0014613045711303128
75th percentile : 0.0014753195027878974
76th percentile : 0.0015038495929911733
77th percentile : 0.0015557835585786961
78th percentile : 0.0016145986938499845
79th percentile : 0.0016635114574455661
80th percentile : 0.0017294109973590823
81th percentile : 0.0017680707048566549
82th percentile : 0.0017967176585807466
83th percentile : 0.001821952804166358
84th percentile : 0.0018896335212048138
85th percentile : 0.0019280065003840713
86th percentile : 0.00203443425882142
87th percentile : 0.0021526487289520433
88th percentile : 0.002375598326325417
89th percentile : 0.0024667518323985872
90th percentile : 0.002657307902700269
91th percentile : 0.0028080595609208097
92th percentile : 0.003023920595878735
93th percentile : 0.0033062145394797023
94th percentile : 0.003599669467075731
95th percentile : 0.004007114299020031
96th percentile : 0.004549380357493646
97th percentile : 0.005604980476782611
98th percentile : 0.007550094650941901
99th percentile : 0.010168014702503538
100th percentile : 0.23994966299505904
Total Time : 1.141646215095534

What is coming up next?

  • Will depend on the review from the mentors. If everything looks good to them, I would shift my focus back on Scrapy.

Did you get stuck anywhere?

  • Nothing major.

Real Python: Dictionaries in Python

$
0
0

Python provides a composite data type called a dictionary, which is similar to a list in that it is a collection of objects.

Here’s what you’ll learn in this course: You’ll cover the basic characteristics of Python dictionaries and learn how to access and manage dictionary data. Once you’ve finished this course, you’ll have a good sense of when a dictionary is the appropriate data type to use and know how to use it.

Dictionaries and lists share the following characteristics:

  • Both are mutable.
  • Both are dynamic. They can grow and shrink as needed.
  • Both can be nested. A list can contain another list. A dictionary can contain another dictionary. A dictionary can also contain a list, and vice versa.

Dictionaries differ from lists primarily in how elements are accessed:

  • List elements are accessed by their position in the list, via indexing.
  • Dictionary elements are accessed via keys.

[ Improve Your Python With 🐍 Python Tricks 💌 – Get a short & sweet Python Trick delivered to your inbox every couple of days. >> Click here to learn more and see examples ]

PSF GSoC students blogs: We are in the endgame NOW @ 2048

$
0
0


<meta charset="utf-8">

Week #10 24/07 to 30/07

Well, only 2 weeks and some days left to go. Oh boy, the time it has been. I wish to keep working if they let me. 
 

What did you do this week?

Integration finally worked out !! You know what that means? That mean, my project is almost complete. <meta charset="utf-8">Here’s an informal take on how the week went, it was bumpy codewise, but we made it through to this outcome. 

To be very frank, Julio. I haven't had my fair share of practice with comprehensions in Python and this took a minute to figure out as did the entire test_pipelines.py and pipelines.pywhich took days to get through. This isn't complex Python, it's good code but there is just so much going on and I am not sure if the tests that I created are the best possible because I kept going back and forth between the code not able to figure what is the output from what function in this part of the code. As one can't just throw logging statements and run the file or project that we normally do. And I just wanted to do it on my own at that point, because I thought a bit more effort into this last bit and things might get clearer. And they did. I am happy that I did the work that was needed.

At one point on the Sunday night, I just gave up and initialized the ItemValidationPipeline(), imported everything just to see what was going on line by line. Good hunting. I am happy that it worked out (Cerberus Integration), but not happy with the tests and would like to make it better. Codewise.


What is coming up next? 

We are left with unittests for the pipelines Cerberus integrated bit, documentation for the features and last but not least system testing. Here’s an informal take on how the week went. 


Did you get stuck anywhere?

I am not sure this question brings me joy to answer. 

So, I say yes!! I got stuck in a lot of places around this weekend. But, I am proud to say with the guidance of my mentors and some of my will. The confidence to debug the lines of code written this week was never broken, and will never be broken. Thank you everyone who helped!

TechBeamers Python: How to Merge Dictionaries in Python?

$
0
0

In this post, we are describing different ways to merge dictionaries in Python. There is no built-in method to combine them, but we can make some arrangements to do that. The few options that we’ll use are the dictionary’s update method and Python 3.5’s dictionary unpacking operator or also known as **kwargs. Some of the methods need a few lines of code to merge while one can combine the dictionaries in a single expression. Also, you need to be decisive in selecting which of the solution suits your condition the best. So, let’s now step up to see the different

The post How to Merge Dictionaries in Python? appeared first on Learn Programming and Software Testing.


Mike Driscoll: Summer Python Book Sale

$
0
0

It’s summer time and now is a great time to learn Python! To help with that, I am running a sale of my Python books for the next week. The sale ends August 6th. All books are $9.99-$14.99 on Leanpub!

All My Python Books


Creating GUI Applications with wxPython

Creating GUI Applications with wxPython is my latest book. In it you will learn how to create cross-platform desktop applications using wxPython. Use this link or click the image above to get a discount.


Jupyter Notebook 101

The Jupyter Notebook is a great teaching tool and it’s a fun way to use and learn Python and data science. I wrote a nice introductory book on the topic called Jupyter Notebook 101.


ReportLab – PDF Processing with Python

Creating and manipulating PDFs with Python is fun! In ReportLab – PDF Processing with Python you will learn how to create PDFs using the ReportLab package. You will also learn how to manipulate pre-existing PDFs using PyPDF2 and pdfrw as well as a few other handy PDF-related Python packages.


Python 201: Intermediate Python

Python 201: Intermediate Python

Python 201: Intermediate Python is a sequel to my first book, Python 101 and teaches its readers intermediate to advanced topics in Python.

The post Summer Python Book Sale appeared first on The Mouse Vs. The Python.

PyCoder’s Weekly: Issue #379 (July 30, 2019)

$
0
0

#379 – JULY 30, 2019
View in Browser »

The PyCoder’s Weekly Logo


What’s Coming in Python 3.8

“The Python 3.8 beta cycle is already underway, with Python 3.8.0b1 released on June 4, followed by the second beta on July 4. That means that Python 3.8 is feature complete at this point, which makes it a good time to see what will be part of it when the final release is made.”
JAKE EDGE

PyLint False Positives

“In some recent discussion on Reddit, I claimed that, for cases where I’m already using flake8, it seemed as though 95% of Pylint’s reported problems were false positives. Others had very different experiences, so I was intrigued enough to actually do some measurements.”
LUKE PLANT

Automate Your Code Review Process With Codacy

alt

Take the hassle out of code reviews—Codacy flags errors automatically, directly from your Git workflow. Customize standards on coverage, duplication, complexity & style violations. Use in the cloud or on private servers—free for open source projects & small teams →
CODACYsponsor

Understanding the Python Traceback

Learn how to read and understand the information you can get from a Python traceback. You’ll walk through several examples of tracebacks and see how to handle some of the most common types of exceptions in Python.
REAL PYTHON

Django vs Flask in 2019: Which Framework to Choose

In this article, you’ll take a look at the best use cases for Django and Flask along with what makes them unique, from an educational and development standpoint.
MICHAEL HERMAN• Shared by Michael Herman

Dictionaries in Python

In this course on Python dictionaries, you’ll cover the basic characteristics of dictionaries and learn how to access and manage dictionary data. Once you’ve finished this course, you’ll have a good sense of when a dictionary is the appropriate data type to use and know how to use it.
REAL PYTHONvideo

Discussions

Python Jobs

Backend and DataScience Engineers (London, Relocation & Visa Possible)

Citymapper Ltd

Software Engineering Lead, Python (Houston, TX)

SimpleLegal

Software Engineer (Multiple US Locations)

Invitae

Python Software Engineer (Munich, Germany)

Stylight GmbH

Senior Back-End Web Developer (Vancouver, BC)

7Geese

Lead Data Scientist (Buffalo, NY)

Utilant LLC

Python Developer (Remote)

418 Media

Sr. Python Engineer (Arlington, VA)

Public Broadcasting Service

Senior Backend Software Engineer (Remote)

Close

More Python Jobs >>>

Articles & Tutorials

4 Attempts at Packaging Python as an Executable

Interesting recap of the author’s experience creating a single-file executable of a Python application using four different tools: Cython, Nuitka, PyOxidizer, and PyInstaller.
CHRISTIAN MEDINA• Shared by Christian Medina

Neural Networks From Scratch, With Python

A 4-post series that provides a fundamentals-oriented approach towards understanding Neural Networks.
VICTOR ZHOU

Python Developers Are in Demand on Vettery

alt

Vettery is an online hiring marketplace that’s changing the way people hire and get hired. Ready for a bold career move? Make a free profile, name your salary, and connect with hiring managers from top employers today →
VETTERYsponsor

Docker Packaging Guide for Python

A detailed guide to creating production-ready Docker images for your Python applications.
ITAMAR TURNER-TRAURING

The 35 Words You Need to Python

“I’m going to try, in this post and the ones that follow, to shed some light on the meaning of – and a little of the etymological history behind – the fundamental units of Python fluency. In this first part we will start with the most basic of those units, Python’s 35 keywords.”
MICHAEL MOREHOUSE

Cyclical Learning Rates With Keras and Deep Learning

In this tutorial, you will learn how to use Cyclical Learning Rates (CLR) and Keras to train your own neural networks. Using Cyclical Learning Rates you can dramatically reduce the number of experiments required to tune and find an optimal learning rate for your model.
ADRIAN ROSEBROCK

Digging Deeper Into Migrations

In this step-by-step Python tutorial, you’ll not only take a closer look at the new Django migrations system that is integrated into Django but also walk through the migration files themselves.
REAL PYTHON

Best Practices for PySpark ETL Projects

A tutorial on how best to reason about and structure ETL jobs written for PySpark, so that they are robust, reusable, testable, easy to debug and ready for production.
ALEX IOANNIDES• Shared by Alex Ioannides

Efficiently Generating Python Hash Collisions

“While this research demonstrates a fundamental break in the Python 3.2 (or below) hash algorithm, Python fixed this issue 7 years ago. It’s time to upgrade.”
LEE HOLMES

The Best Editors and IDEs for Teaching Python

In this episode of Teaching Python, Sean and Kelly discuss their top 5 favorite editors for teaching (and learning) Python.
TEACHINGPYTHON.FMpodcast

Projects & Code

Wait Wait… Don’t Tell Me! Stats and Show Details

Here, you will find almost everything you might want to know about the NPR news quiz show. Project is written in Python and partially open-source.
WWDT.ME

Events

DjangoCon AU 2019

August 2 to August 3, 2019
DJANGOCON.COM.AU

PyCon AU 2019

August 2 to August 7, 2019
PYCON-AU.ORG

PyBay 2019

August 15 to 16 in San Francisco, California
PYBAY.COM


Happy Pythoning!
This was PyCoder’s Weekly Issue #379.
View in Browser »

alt

[ Subscribe to 🐍 PyCoder’s Weekly 💌 – Get the best Python news, articles, and tutorials delivered to your inbox once a week >> Click here to learn more ]

PSF GSoC students blogs: GSoC Weekly Checkin

$
0
0

Hello everyone!

Second Evaluations are over and passed it with a great feedback.

What did I do this week?

This week after everyone approved the new Icons Picker page, I made its front end and and connected it with the API. The front end part is completed and I am still working on a bit of JS to for more functionality and connecting it with the API I made. 

What is coming up next week?

My project is almost completed. Next week we plan to test it and improve User Experience. Meanwhile, I wait for other student to complete his part of project so that I can implement components of my project to it.

Did I get stuck anywhere?

Not much, but some linter errors  gave me a really hard time.

Till next time,
Cheers!

Talk Python to Me: #223 Fun and Easy 2D Games with Python

$
0
0
Have you tried to teach programming to beginners? Python is becoming a top choice for the language, but you still have to have them work with the language and understand core concepts like loops, variables, classes, and more. It turns out, video game programming, when kept simple, can be great for this. Need to repeat items in a scene? There's a natural situation to introduce loops. Move an item around? Maybe make a function to redraw it at a location.

Thibauld Nion: Why leave Wordpress behind for Nikola ?

$
0
0

In my previous post I announced my website's migration from Wordpress to Nikola.

Still, with Wordpress having been my site's engine for so many years, I feel that I owe a few explanations to the community.

In this post I'll enumerate what stands out in my (very good !) experience with Wordpress, plus a few words about zenPhoto and what makes the difference between those two and Nikola.

Read more… (3 min remaining to read)

Viewing all 22880 articles
Browse latest View live


<script src="https://jsc.adskeeper.com/r/s/rssing.com.1596347.js" async> </script>