Quantcast
Channel: Planet Python
Viewing all 24375 articles
Browse latest View live

Anwesha Das: Developers, it's License but it's easy

$
0
0

I recently conducted a session on “Software Licensing: The Basic Concepts.”
Just after I mentioned the term, “license”, questions flooded in.

One of those was quite interesting, “How do we create a copyright license?”
I couldn’t get to it in time that day, so I thought, why not answer it here on the blog?

I am jotting down some best practices regarding choosing and declaring a license. Knowing something in theory and implementing it in real life are two completely different things.
Here I will be stressing real life scenarios.

These are the best possible ways of shouting out to the world,

“My project is licensed under this license.
If you want to use it please follow the rules made thereunder.”

Our discussion can be divided into two parts:

How to choose a license for your project?

Choosing a license is always difficult. It’s like choosing your favorite superhero character in the Avengers. You go and

  • read different things out there,
  • watch videos,
  • ask friends (who you think, know more than you about licenses).

But the stuff above holds true with only 15% of the whole developer lot (I am being really conservative about the percentage).

Most of them choose a license,

  • to end the frustration of reading the license document
  • by picking the first one that appears in any list provided
  • by following their friends’ choices
  • by defaulting to the license, you first heard of,
  • because you share similar values as the license project itself

The following are some basic ways of choosing a license in a proper manner:

1. Understand the License:

For choosing one amongst thirty different things, one has to comprehend the generic concept of what said thing is. When choosing between different laptops, one has to recognize what a laptop is.
So for choosing a license one has to know what license is (in general.)

License means permission.

It is a way of authorizing somebody to use something that you own, have a right to; your property. In the case of software licenses, we are dealing with Copyright. The license document specifies the terms, rules you have to follow to use someone else’s copyrighted software.

Let’s make life simple. Let us take a real life example of a driving license. What does a driving license do? It gives you the permission to drive a vehicle on the road. Similarly, a software license gives you the permission to do certain things with software. In the case of a driving license the motor vehicle authority gives you the permission, and for the software license, the owner of the software gives you permission. The motor vehicle authority is empowered by the govt to issue a driving license whereas in the software realm (just as with writing) the owner gets his authority under one of the legal rights governing intellectual realms called copyright. (I’m stretching the analogy a bit here, but it makes the picture clear).

2. Understand the License:

In our laptop example above, in order to choose the right laptop, you need to know the configuration that’ll suit you. Are you writer? A gamer? A coder? Watch movies? Knowing what you need is important.
The same theory holds with software licenses.

The first step to understand a license is to:

A. Read the license document carefully before you a choose one Go through the license document itself. Yes, I know! It’s big, it’s boring and legal. But once you understand it, you are sorted for quite a long time.

Reading the license document will give you a clear idea of -

i. The rights you are actually licensing.
ii. What the license requires of you. Each license stipulates certain conditions. It requires you to do certain things; to follow certain steps, for them to be applicable. Let’s take the MIT license as an example. There are many packages are marked as being under the MIT license in their meta data, but don't actually include a copy of the license text with their code. In fact, the MIT license specifically states that you need to include the permission notice in all copies or substantial portions of the Software. Therefore in this instance, the terms of the MIT License don’t actually apply to the software, though it was intended to be.

B. License matching the use case Choose a license matching the use case of your software. A license that accomplishes the goal of your software. A license actually shows your aim, your intention, and what you want to do with the software to the users; so be very careful when choosing one.

C. Spent some time choosing the license Your license is a very important document. It will decide the future of your project. Therefore, once again, be very careful while choosing it.
Do not hurry. Choosing a license is similar to investing in mutual funds. Do your homework and be intentional and sure in the choosing now, than be sorry in the future.

3. There are some basic points one may keep in mind to choose the license:

A. When freedom is important If you care about freedom and sharing improvements to the community and society, then the GNU GPL is the license for you. In the case of the GPL, you need to distribute the original source code along with the modifications you have made.

B. Patent Concerns When Patent is your primary concern, then the Apache and similar licenses which have the “Grant of Patent” is your solution.

“Grant of Patent” ensures that the end user can use the software without any legal threats related to patents. Let’s try to understand this with an example. A company has a patent on a particular software algorithm. Then that same company releases an open source library that implements said algorithm. If it is released under a license that does not include a patent grant, it (the company itself) could sue people using their (open source) software under patent law.
By licensing the code under a license that includes a patent grant, a company is saying “We’re not going to sue you for using any patents related to the software which we've made open source.”

C. Permissive nature: If you want something that anyone can use, for any purpose, even proprietary usage, then you might want to opt for licenses permissive in nature, such as the MIT & the BSD licenses.

4. And you are confused now? Where do I go? What to choose from? What are my options?

Here are a few solutions:

A. Free Software Foundation: It maintains a well-drafted FAQ answering all your queries regarding its free software licenses. Before choosing a license you might want to have a look at it

B. OSI OSI the open source initiative has a list of the open source licenses and guidelines to do the same.

C. choosealicense.com This handy website by GitHub actually walks you through most requirements and suggests an apt license

D. Available licenses Looking for more options? You can have look at the licensing wiki of Fedora project. It is a really nice page maintained by Tom Spot Callaway.

E. Choose a popular license If you are confused that what license to choose, go for those ones which are popularly used by the community (more specifically, by the people you want to work with.) To make your project widely used one should choose a popular license. It will be easier for the community to use your software without being worried about compatibility issues.

5. Cautionary statement:

1. NO license invention Please do not invent your own license. There are plenty of nicely drafted licenses meeting all your requirements. Trust the legal experts; they know the law.

2. Keep your funny bones aside If you ignore all the caution and try to draft your own license try not to have clauses like "Buy me a beer" or "Don't be evil" (please keep your funny bones to yourselves). Not that I have an objection if the developer/user treats you to a bear nor am I a great supporter of evil.
It’s just that the legal implications of these are different.

If you are confused about what licenses to choose, you may look into various lists provided by the different websites above.

How do I create a license?

To me, that’s just another way to ask the same thing above.
Remember - “Don’t Invent Your Own License!”
What you actually want to know, is how to let the world know what license your project actually uses.

Here are some basic steps:

1. Create a LICENSE file

Create a LICENSE file, generally a plain text file. The file should have the name of the license as well as the full license text of the license document.

2. Add a copyright header

Add a copyright header to each significant source code file. By significant, I mean the volume and importance both. And modify it from time to time, as you make new releases.
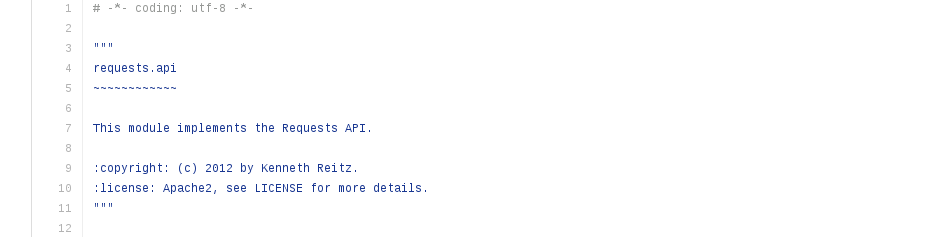
In the above example, you can see that the name of the author and the license, the year has been mentioned.

3. Mention the license in the setup.py (in the case of a Python project)

The name of the license should be mentioned in the setup function within setup.py

4. License in a README file

If you have a README or equivalent introductory file, containing all the basic information of the project. State the name of the license there and refer the reader to the LICENSE file.

I have tried to provide you with a small, tiny mini, checklist so that it is helpful for you while you choose a license for your project.

Go forth & License!


codeboje: Review: Python Hunting Book

$
0
0

I recently stumbled up on a book about game programming with PyGame for beginners. Even I am not the target audience it did catch my attention and my desire to play a bit again with game development and Python. And I had a fantastic time so far :-)

TLDR: I think it is a great book for learning python and game development at the same time. The author duo does a great job in explaining the concepts involved and at the right time and pace.

Disclaimer: I got a review copy for free. However, it was at my request, and my opinion is still my own.

Python Hunting: A beginner's guide to programming and game building in Python for teens, tweens and newbies.

python hunting cover

Link to Amazon*

This is for you?

If you have never programmed before but are curious about developing your first simple games or learning Python. It's written in a conversational style with younger folks as the readers; nonetheless, it's even a good fit for the older (like me :-)).

What will you learn?

You will start with building an animated scene of falling rain, adding a cloud and a guy with his umbrella.

Shortly after, this is turned into a space invaders game.

You'll then develop pong, a fly catching game and last but not least a tank game. Along with developing the games step by step you'll learn how Python works, what variables are, tuples, list and all the other stuff you need to know for developing these games. They'll also cover some simple math; fear not, it is simple and with good explanations.

Which leads me to the biggest benefit this book has. It's way of explaining things. It's clear, concise, with a good pace, and just in time, so you never feel overwhelmed.

On the game developing side, you learn the concept of a game loop, animation, moving stuff around, collision detection and a bit more.

Conclusion

I love this book, and it was a fun time for me to write the first two games and I'll definitely finish the others too. Sure, as an experienced developer I am not the target audience, but I have fun nonetheless.

The explanation and teaching are great, and I recommend it to anyone interested in learning Python and/or games.

Sandipan Dey: Some Analysis with Astronomy data (in python)

$
0
0
Data-Driven Astronomy The following problems appeared as assignments in the coursera course Data-Driven Astronomy. The description of the problems are taken mostly from the course assignments and from https://groklearning.com/learn/data-driven-astro/.   One of the most widely used formats for astronomical images is the Flexible Image Transport System. In a FITS file, the image is stored in a numerical array. The FITS files shown … Continue reading Some Analysis with Astronomy data (in python)

Weekly Python StackOverflow Report: (lxxxiv) stackoverflow python report

$
0
0

Sandipan Dey: Some Analysis with Astronomy data (in Python)

$
0
0
Data-Driven Astronomy The following problems appeared as assignments in the coursera course Data-Driven Astronomy. The description of the problems are taken mostly from the course assignments and from https://groklearning.com/learn/data-driven-astro/.   One of the most widely used formats for astronomical images is the Flexible Image Transport System. In a FITS file, the image is stored in a numerical array. The FITS files shown … Continue reading Some Analysis with Astronomy data (in Python)

Anarcat: My free software activities, July 2017

$
0
0

Debian Long Term Support (LTS)

This is my monthly working on Debian LTS. This time I worked on various hairy issues surrounding ca-certificates, unattended-upgrades, apache2 regressions, libmtp, tcpdump and ipsec-tools.

ca-certificates updates

I've been working on the removal of the Wosign and StartCom certificates (Debian bug #858539) and, in general, the synchronisation of ca-certificates across suites (Debian bug #867461) since at least last march. I have made an attempt at summarizing the issue which led to a productive discussion and it seems that, in the end, the maintainer will take care of synchronizing information across suites.

Guido was right in again raising the question of synchronizing NSS across all suites (Debian bug #824872) which itself raised the other question of how to test reverse dependencies. This brings me back to Debian bug #817286 which, basically proposed the idea of having "proposed updates" for security issues. The problem is while we can upload test packages to stable proposed-updates, we can't do the same in LTS because the suite is closed and we operate only on security packages. This issue came up before in other security upload and we need to think better about how to solve this.

unattended-upgrades

Speaking of security upgrades brings me to the question of a bug (Debian bug #867169) that was filed against the wheezy version of unattended-upgrades, which showed that the package simply stopped working since the latest stable release, because wheezy became "oldoldstable". I first suggested using the "codename" but that appears to have been introduced only after wheezy.

In the end, I proposed a simple update that would fix the configuration files and uploaded this as DLA-1032-1. This is thankfully fixed in later releases and will not require such hackery when jessie becomes LTS as well.

libmtp

Next up is the work on the libmtp vulnerabilities (CVE-2017-9831 and CVE-2017-9832). As I described in my announcement, the work to backport the patch was huge, as upstream basically backported a whole library from the gphoto2 package to fix those issues (and probably many more). The lack of a test suite made it difficult to trust my own work, but given that I had no (negative) feedback, I figured it was okay to simply upload the result and that became DLA-1029-1.

tcpdump

I then looked at reproducing CVE-2017-11108, a heap overflow triggered tcpdump would parse specifically STP packets. In Debian bug #867718, I described how to reproduce the issue across all suites and opened an issue upstream, given that the upstream maintainers hadn't responded responded in weeks according to notes in the RedHat Bugzilla issue. I eventually worked on a patch which I shared upstream, but that was rejected as they were already working on it in their embargoed repository.

I can explain this confusion and duplication of work with:

  1. the original submitter didn't really contact security@tcpdump.org
  2. he did and they didn't reply, being just too busy
  3. they replied and he didn't relay that information back

I think #2 is most likely: the tcpdump.org folks are probably very busy with tons of reports like this. Still, I should probably have contacted security@tcpdump.org directly before starting my work, even though no harm was done because I didn't divulge issues that were already public.

Since then, tcpdump has released 4.9.1 which fixes the issue, but then new CVEs came out that will require more work and probably another release. People looking into this issue must be certain to coordinate with the tcpdump security team before fixing the actual issues.

ipsec-tools

Another package that didn't quite have a working solution is the ipsec-tools suite, in which the racoon daemon was vulnerable to a remotely-triggered DOS attack (CVE-2016-10396). I reviewed and fixed the upstream patch which introduced a regression. Unfortunately, there is no test suite or proof of concept to control the results.

The reality is that ipsec-tools is really old, and should maybe simply be removed from Debian, in favor of strongswan. Upstream hasn't done a release in years and various distributions have patched up forks of those to keep it alive... I was happy, however, to know that a maintainer will take care of updating the various suites, including LTS, with my improved patch. So this fixes the issue for now, but I would strongly encourage users to switch away from ipsec-tools in the future.

apache2

Finally, I was bitten by the old DLA-841-1 upload I did all the way back in February, as it introduced a regression (Debian bug #858373). It turns out it was possible to segfault Apache workers with a trivial HTTP request, in certain (rather exotic, I might add) configurations (ErrorDocument 400 directive pointing to a cgid script in worker mode).

Still, it was a serious regression and I found a part of the nasty long patch we worked on back then that was faulty, and introduced a small fix to correct that. The proposed package unfortunately didn't yield any feedback, and I can only assume it will work okay for people. The result is the DLA-841-2 upload which fixes the regression. I unfortunately didn't have time to work on the remaining CVEs affecting apache2 in LTS at the time of writing.

Triage

I also did some miscellaneous triage by filing Debian bug #867477 for poppler in an effort to document better the pending issue.

Next up was some minor work on eglibc issues. CVE-2017-8804 has a patch, but it's been disputed. since the main victim of this and the core of the vulnerability (rpcbind) has already been fixed, I am not sure this vulnerability is still a thing in LTS at all.

I also looked at CVE-2014-9984, but the code is so different in wheezy that I wonder if LTS is affected at all. Unfortunately, the eglibc gymnastics are a little beyond me and I do not feel confident enough to just push those issues aside for now and let them open for others to look at.

Other free software work

And of course, there's my usual monthly volunteer work. My ratio is a little better this time, having reached an about even ratio between paid and volunteer work, whereas this was 60% volunteer work in march.

Announcing ecdysis

I recently published ecdysis, a set of template and code samples that I frequently reuse across project. This is probably the least pronounceable project name I have ever chosen, but this is somewhat on purpose. The goal of this project is not collaboration or to become a library: it's just a personal project which I share with the world as a curiosity.

To quote the README file:

The name comes from what snakes and other animals do to "create a new snake": they shed their skin. This is not so appropriate for snakes, as it's just a way to rejuvenate their skin, but is especially relevant for anthropods since then "ecdysis" may be associated with a metamorphosis:

Ecdysis is the moulting of the cuticle in many invertebrates of the clade Ecdysozoa. Since the cuticle of these animals typically forms a largely inelastic exoskeleton, it is shed during growth and a new, larger covering is formed. The remnants of the old, empty exoskeleton are called exuviae. — Wikipedia

So this project is metamorphosed into others when the documentation templates, code examples and so on are reused elsewhere. For that reason, the license is an unusally liberal (for me) MIT/Expat license.

The name also has the nice property of being absolutely unpronounceable, which makes it unlikely to be copied but easy to search online.

It was an interesting exercise to go back into older projects and factor out interesting code. The process is not complete yet, as there are older projects I'm still curious in reviewing. A bunch of that code could also be factored into upstream project and maybe even the Python standard library.

In short, this is stuff I keep on forgetting how to do: a proper setup.py config, some fancy argparse extensions and so on. Instead of having to remember where I had written that clever piece of code, I now shove it in the crazy chaotic project where I can find it again in the future.

Beets experiments

Since I started using Subsonic (or Libresonic) to manage the music on my phone, album covers are suddenly way more interesting. But my collection so far has had limited album covers: my other media player (gmpc) would download those on the fly on its own and store them in its own database - not on the filesystem. I guess this could be considered to be a limitation of Subsonic, but I actually appreciate the separation of duty here. Garbage in, garbage out: the quality of Subsonic's rendering depends largely on how well setup your library and tags are.

It turns out there is an amazing tool called beets to do exactly that kind of stuff. I originally discarded that "media library management system for obsessive-compulsive [OC] music geeks", trying to convince myself i was not an "OC music geek". Turns out I am. Oh well.

Thanks to beets, I was able to download album covers for a lot of the albums in my collection. The only covers that are missing now are albums that are not correctly tagged and that beets couldn't automatically fix up. I still need to go through those and fix all those tags, but the first run did an impressive job at getting album covers.

Then I got the next crazy idea: after a camping trip where we forgot (again) the lyrics to Georges Brassens, I figured I could start putting some lyrics on my ebook reader. "How hard can that be?" of course, being the start of another crazy project. A pull request and 3 days later, I had something that could turn a beets lyrics database into a Sphinx document which, in turn, can be turned into an ePUB. In the process, I probably got blocked from MusixMatch a hundred times, but it's done. Phew!

The resulting e-book is about 8000 pages long, but is still surprisingly responsive. In the process, I also happened to do a partial benchmark of Python's bloom filter libraries. The biggest surprise there was the performance of the set builtin: for small items, it is basically as fast as a bloom filter. Of course, when the item size grows larger, its memory usage explodes, but in this case it turned out to be sufficient and bloom filter completely overkill and confusing.

Oh, and thanks to those efforts, I got admitted in the beetbox organization on GitHub! I am not sure what I will do with that newfound power: I was just scratching an itch, really. But hopefully I'll be able to help here and there in the future as well.

Debian package maintenance

I did some normal upkeep on a bunch of my packages this month, that were long overdue:

  • uploadedslop 6.3.47-1: major new upstream release
  • uploaded an NMU for maim 5.4.64-1.1: maim was broken by the slop release
  • uploadedpv 1.6.6-1: new upstream release
  • uploadedkedpm 1.0+deb8u1 to jessie (oldstable): one last security fix (Debian bug #860817, CVE-2017-8296) for that derelict password manager
  • uploadedcharybdis 3.5.5-1: new minor upstream release, with optional support for mbedtls
  • filed Debian bug #866786 against cryptsetup to make the remote initramfs SSH-based unlocking support multiple devices: thanks to the maintainer, this now works flawlessly in buster and may be backported to stretch
  • expanded on Debian bug #805414 against gdm3 and Debian bug #845938 against pulseaudio, because I had trouble connecting my computer to this new Bluetooth speaker. turns out this is a known issue in Pulseaudio: whereas it releases ALSA devices, it doesn't release Bluetooth devices properly. Documented this more clearly in the wiki page
  • filed Debian bug #866790 regarding old stray Apparmor profiles that were lying around my system after an upgrade, which got me interested in Debian bug #830502 in turn
  • filed Debian bug #868728 against cups regarding a weird behavior I had interacting with a network printer. turns out the other workstation was misconfigured... why are printers still so hard?
  • filed Debian bug #870102 to automate sbuild schroots upgrades
  • after playing around with rash tried to complete the packaging (Debian bug #754972) of percol with this pull request upstream. this ended up to be way too much overhead and I reverted to my old normal history habits.

Codementor: Autogenerating blog posts from your project's commit history with python...like a boss.

$
0
0
autogenerate your markdown from git history

Import Python: Import Python 135

$
0
0
Worthy Read

This post contains a step-by-step example of a refactoring session guided by tests. When dealing with untested or legacy code refactoring is dangerous and tests can help us do it the right way, minimizing the amount of bugs we introduce, and possibly completely avoiding them. Refactoring is not easy. It requires a double effort to understand code that others wrote, or that we wrote in the past, and moving around parts of it, simplifying it, in one word improving it, is by no means something for the faint-hearted. Like programming, refactoring has its rules and best practices, but it can be described as a mixture of technique, intuition, experience, risk.
refactoring

Boston’s Massachusetts Bay Transit Authority (MBTA) operates the 4th busiest subway system in the U.S. The MBTA recently began publishing substantial amount of subway data through its public APIs. I performed five analysis.
data science

There are many ways to handle Python app dependencies with Docker. Here is an overview of the most common ones – with a twist.
docker
,
dependency management

Embed docs directly on your website with a few lines of code. Test the API for free
sponsor

In this blog, we will see how we can implement Supervised Learning Algorithm. Linear Regression using SkLearn Library in Python. SkLearn or scikit-learn is one of the most widely used tools for Machine Learning and Data Analysis. It does all the computation allowing you to focus on increasing the efficiency and not on the calculation part of the Algorithm.
supervised learning

Learn to program Python within a multiplayer world we all know and love, Minecraft!
minecraft

Quart is a Python asyncio web microframework with the same API as Flask. Quart should provide a very minimal step to use Asyncio in a Flask app.
flask
,
project

This project give you the ability to generate your Resume from your Github contributions.
offtopic

Matplotlib is a Python 2D plotting library which produces publication quality figures in a variety of hardcopy formats and interactive environments across platforms. Matplotlib can be used in Python scripts and the jupyter notebook, web application servers, and four graphical user interface toolkits.
matpoltlib

The Sklearn library provides several powerful tools that can be used to extract features from text. In this article, I will show you how easy it can be to classify documents based on their content using Sklearn.
machine learning
,
classification

cpython

pydata conference

An exploration of the people behind the projects. Each post is an exclusive interview with a member of the open source community.
open source

In this post, we are documenting how we used Google’s TensorFlow to build this image recognition engine.
image processing
,
tensorflow

dependency management
,
packages
,
distribution

text classification

Bokeh is a Python interactive visualization library that targets modern web browsers for presentation. Its goal is to provide elegant, concise construction of novel graphics in the style of D3.js, and to extend this capability with high-performance interactivity over very large or streaming datasets. Bokeh can help anyone who would like to quickly and easily create interactive plots, dashboards, and data applications.. Bokeh's styling is very nice by default. However, extending Bokeh with your own custom styles can add an impressive level of polish to your visualizations.
graph


Jobs

Remote
Our client are transforming the way Blockchain is viewed and bringing forward the next generation web browser and instant messenger application! Using the latest technologies and environments, this company are looking to make their stamp in the highly lucrative and super exciting Blockchain space.


Projects

SmoothCriminal - 24 Stars, 5 Fork
Detect sandbox by cursor movement speed

ens.py - 11 Stars, 2 Fork
Ethereum Name Service, made easy in Python.

A repository of 14000 Hindi words and their Inverse Document Frequency.

pytorch-kaggle-amazon-space - 8 Stars, 2 Fork
Pytorch solution for Planet: Understanding the Amazon from Space https://www.kaggle.com/c/planet-understanding-the-amazon-from-space

python-code - 3 Stars, 2 Fork
Python Code for AI class

pionic - 0 Stars, 0 Fork
The Ion format is a superset of JSON, adding (among other things) the much-needed timestamp, decimal and binary data types.

text_classification - 0 Stars, 0 Fork
All kinds of text classificaiton models and more with deep learning.


Philippe Normand: The GNOME-Shell Gajim extension maintenance

$
0
0

Back in January 2011 I wrote a GNOME-Shell extension allowing Gajim users to carry on with their chats using the Empathy infrastructure and UI present in the Shell. For some time the extension was also part of the official gnome-shell-extensions module and then I had to move it to …

Jaime Buelta: A Django project template for a RESTful Application using Docker

Full Stack Python: Responsive Bar Charts with Bokeh, Flask and Python 3

$
0
0

Bokeh is a powerful open source Python library that allows developers to generate JavaScript data visualizations for their web applications without writing any JavaScript. While learning a JavaScript-based data visualization library like d3.js can be useful, it's often far easier to knock out a few lines of Python code to get the job done.

With Bokeh, we can create incredibly detailed interactive visualizations, or just traditional ones like the following bar chart.

Responsive Bokeh bar chart with 64 bars.

Let's use the Flaskweb framework with Bokeh to create custom bar charts in a Python web app.

Our Tools

This tutorial works with either Python 2 or 3, but Python 3 is strongly recommended for new applications. I used Python 3.6.1 while writing this post. In addition to Python throughout this tutorial we will also use the following application dependencies:

If you need help getting your development environment configured before running this code, take a look at this guide for setting up Python 3 and Flask on Ubuntu 16.04 LTS

All code in this blog post is available open source under the MIT license on GitHub under the bar-charts-bokeh-flask-python-3 directory of the blog-code-examples repository. Use and abuse the source code as you like for your own applications.

Installing Bokeh and Flask

Create a fresh virtual environment for this project to isolate our dependencies using the following command in the terminal. I typically run this command within a separate venvs directory where all my virtualenvs are store.

python3 -m venv barchart

Activate the virtualenv.

source barchart/bin/activate

The command prompt will change after activating the virtualenv:

Activating our Python virtual environment on the command line.

Keep in mind that you need to activate the virtualenv in every new terminal window where you want to use the virtualenv to run the project.

Bokeh and Flask are installable into the now-activated virtualenv using pip. Run this command to get the appropriate Bokeh and Flask versions.

pip install bokeh==0.12.5 flask==0.12.2 pandas==0.20.1

After a brief download and installation period our required dependencies should be installed within our virtualenv. Look for output to confirm everything worked.

Installing collected packages: six, requests, PyYAML, python-dateutil, MarkupSafe, Jinja2, numpy, tornado, bokeh, Werkzeug, itsdangerous, click, flask, pytz, pandas
  Running setup.py install for PyYAML ... done
  Running setup.py install for MarkupSafe ... done
  Running setup.py install for tornado ... done
  Running setup.py install for bokeh ... done
  Running setup.py install for itsdangerous ... done
Successfully installed Jinja2-2.9.6 MarkupSafe-1.0 PyYAML-3.12 Werkzeug-0.12.2 bokeh-0.12.5 click-6.7 flask-0.12.2 itsdangerous-0.24 numpy-1.12.1 pandas-0.20.1 python-dateutil-2.6.0 pytz-2017.2 requests-2.14.2 six-1.10.0 tornado-4.5.1

Now we can start building our web application.

Starting Our Flask App

We are going to first code a basic Flask application then add our bar chart to the rendered page.

Create a folder for your project then within it create a file named app.py with these initial contents:

fromflaskimportFlask,render_templateapp=Flask(__name__)@app.route("/<int:bars_count>/")defchart(bars_count):ifbars_count<=0:bars_count=1returnrender_template("chart.html",bars_count=bars_count)if__name__=="__main__":app.run(debug=True)

The above code is a short one-route Flask application that defines the chart function. chart takes in an arbitrary integer as input which will later be used to define how much data we want in our bar chart. The render_template function within chart will use a template from Flask's default template engine named Jinja2 to output HTML.

The last two lines in the allow us to run the Flask application from the command line on port 5000 in debug mode. Never use debug mode for production, that's what WSGI servers like Gunicorn are built for.

Create a subdirectory within your project folder named templates. Within templates create a file name chart.html. chart.html was referenced in the chart function of our app.py file so we need to create it before our app will run properly. Populate chart.html with the following Jinja2 markup.

<!DOCTYPE html><html><head><title>Bar charts with Bokeh!</title></head><body><h1>Bugs found over the past {{bars_count}} days</h1></body></html>

chart.html's boilerplate displays the number of bars passed into the chart function via the URL.

The <h1> tag's message on the number of bugs found goes along with our sample app's theme. We will pretend to be charting the number of bugs found by automated tests run each day.

We can test our application out now.

Make sure your virtualenv is still activated and that you are in the base directory of your project where app.py is located. Run app.py using the python command.

$(barchart) python app.py

Go to localhost:5000/16/ in your web browser. You should see a large message that changes when you modify the URL.

Simple Flask app without bar chart

Our simple Flask route is in place but that's not very exciting. Time to add our bar chart.

Generating the Bar Chart

We can build on the basic Flask app foundation that we just wrote with some new Python code that uses Bokeh.

Open app.py back up and change the top of the file to include the following imports.

importrandomfrombokeh.modelsimport(HoverTool,FactorRange,Plot,LinearAxis,Grid,Range1d)frombokeh.models.glyphsimportVBarfrombokeh.plottingimportfigurefrombokeh.chartsimportBarfrombokeh.embedimportcomponentsfrombokeh.models.sourcesimportColumnDataSourcefromflaskimportFlask,render_template

Throughout the rest of the file we will need these Bokeh imports along with the random module to generate data and our bar chart.

Our bar chart will use "software bugs found" as a theme. The data will be randomly generated each time the page is refreshed. In a real application you'd have a more stable and useful data source!

Continue modifying app.py so the section after the imports looks like the following code.

app=Flask(__name__)@app.route("/<int:bars_count>/")defchart(bars_count):ifbars_count<=0:bars_count=1data={"days":[],"bugs":[],"costs":[]}foriinrange(1,bars_count+1):data['days'].append(i)data['bugs'].append(random.randint(1,100))data['costs'].append(random.uniform(1.00,1000.00))hover=create_hover_tool()plot=create_bar_chart(data,"Bugs found per day","days","bugs",hover)script,div=components(plot)returnrender_template("chart.html",bars_count=bars_count,the_div=div,the_script=script)

The chart function gains three new lists that are randomly generated by Python 3's super-handy random module.

chart calls two functions, create_hover_tool and create_bar_chart. We haven't written those functions yet so continue adding code below chart:

defcreate_hover_tool():# we'll code this function in a momentreturnNonedefcreate_bar_chart(data,title,x_name,y_name,hover_tool=None,width=1200,height=300):"""Creates a bar chart plot with the exact styling for the centcom       dashboard. Pass in data as a dictionary, desired plot title,       name of x axis, y axis and the hover tool HTML."""source=ColumnDataSource(data)xdr=FactorRange(factors=data[x_name])ydr=Range1d(start=0,end=max(data[y_name])*1.5)tools=[]ifhover_tool:tools=[hover_tool,]plot=figure(title=title,x_range=xdr,y_range=ydr,plot_width=width,plot_height=height,h_symmetry=False,v_symmetry=False,min_border=0,toolbar_location="above",tools=tools,responsive=True,outline_line_color="#666666")glyph=VBar(x=x_name,top=y_name,bottom=0,width=.8,fill_color="#e12127")plot.add_glyph(source,glyph)xaxis=LinearAxis()yaxis=LinearAxis()plot.add_layout(Grid(dimension=0,ticker=xaxis.ticker))plot.add_layout(Grid(dimension=1,ticker=yaxis.ticker))plot.toolbar.logo=Noneplot.min_border_top=0plot.xgrid.grid_line_color=Noneplot.ygrid.grid_line_color="#999999"plot.yaxis.axis_label="Bugs found"plot.ygrid.grid_line_alpha=0.1plot.xaxis.axis_label="Days after app deployment"plot.xaxis.major_label_orientation=1returnplot

There is a whole lot of new code above so let's break it down. The create_hover_tool function does not do anything yet, it simply returns None, which we can use if we do not want a hover tool. The hover tool is an overlay that appears when we move our mouse cursor over one of the bars or touch a bar on a touchscreen so we can see more data about the bar.

Within the create_bar_chart function we take in our generated data source and convert it into a ColumnDataSource object that is one type of input object we can pass to Bokeh functions. We specify two ranges for the chart's x and y axes.

Since we do not yet have a hover tool the tools list will remain empty. The line where we create plot using the figure function is where a lot of the magic happens. We specify all the parameters we want our graph to have such as the size, toolbar, borders and whether or not the graph should be responsive upon changing the web browser size.

We create vertical bars with the VBar object and add them to the plot using the add_glyph function that combines our source data with the VBar specification.

The last lines of the function modify the look and feel of the graph. For example I took away the Bokeh logo by specifying plot.toolbar.logo = None and added labels to both axes. I recommend keeping the bokeh.plottin documentation open to know what your options are for customizing your visualizations.

We just need a few updates to our templates/chart.html file to display the visualization. Open the file and add these 6 lines to the file. Two of these lines are for the required CSS, two are JavaScript Bokeh files and the remaining two are the generated chart.

<!DOCTYPE html><html><head><title>Bar charts with Bokeh!</title><linkhref="http://cdn.pydata.org/bokeh/release/bokeh-0.12.5.min.css"rel="stylesheet"><linkhref="http://cdn.pydata.org/bokeh/release/bokeh-widgets-0.12.0.min.css"rel="stylesheet"></head><body><h1>Bugs found over the past {{bars_count}} days</h1>{{the_div|safe}}<scriptsrc="http://cdn.pydata.org/bokeh/release/bokeh-0.12.5.min.js"></script><scriptsrc="http://cdn.pydata.org/bokeh/release/bokeh-widgets-0.12.5.min.js"></script>{{the_script|safe}}</body></html>

Alright, let's give our app a try with a simple chart of 4 bars. The Flask app should automatically reload when you save app.py with the new code but if you shut down the development server fire it back up with the python app.py command.

Open your browser to localhost:5000/4/.

Responsive Bokeh bar chart with 4 bars.

That one looks a bit sparse, so we can crank it up by 4x to 16 bars by going to localhost:5000/16/.

Responsive Bokeh bar chart with 16 bars.

Now another 4x to 128 bars with localhost:5000/128/...

Responsive Bokeh bar chart with 128 bars.

Looking good so far. But what about that hover tool to drill down into each bar for more data? We can add the hover with just a few lines of code in the create_hover_tool function.

Adding a Hover Tool

Within app.py modify the create_hover_tool to match the following code.

defcreate_hover_tool():"""Generates the HTML for the Bokeh's hover data tool on our graph."""hover_html="""<div><span class="hover-tooltip">$x</span></div><div><span class="hover-tooltip">@bugs bugs</span></div><div><span class="hover-tooltip">$@costs{0.00}</span></div>"""returnHoverTool(tooltips=hover_html)

It may look really odd to have HTML embedded within your Python application, but that's how we specify what the hover tool should display. We use $x to show the bar's x axis, @bugs to show the "bugs" field from our data source, and $@costs{0.00} to show the "costs" field formatted as a dollar amount with exactly 2 decimal places.

Make sure you changed return None to return HoverTool(tooltips=hover_html) so we can see the results of our new function in the graph.

Head back to the browser and reload the localhost:5000/128/ page.

Responsive Bokeh bar chart with 128 bars and showing the hover tool.

Nice work! Try playing around with the number of bars in the URL and the window size to see what the graph looks like under different conditions.

The chart gets crowded with more than 100 or so bars, but you can give it a try with whatever number of bars you want. Here is what an impractical amount of 50,000 bars looks like just for the heck of it:

Responsive Bokeh bar chart with 50000 bars.

Yea, we may need to do some additional work to display more than a few hundred bars at a time.

What's next?

You just created a nifty configurable bar chart in Bokeh. Next you can modify the color scheme, change the input data source, try to create other types of charts or solve how to display very large numbers of bars.

There is a lot more than Bokeh can do, so be sure to check out the official project documentation , GitHub repository, the Full Stack Python Bokeh page or take a look at other topics on Full Stack Python.

Questions? Let me know via a GitHub issue ticket on the Full Stack Python repository, on Twitter @fullstackpython or @mattmakai.

See something wrong in this blog post? Fork this page's source on GitHub and submit a pull request.

Full Stack Python: Creating Bar Chart Visuals with Bokeh, Bottle and Python 3

$
0
0

The Bokeh open source Python visualization library assists developers with creating web browser visuals. You can build charts for web applications without coding any JavaScript, like you'd need to do to use libraries such as d3.js and plotly.

Bokeh can create many common and custom visualizations using only Python, such as this bar chart we will create in this tutorial:

Responsive Bokeh bar chart with 48 bars.

Let's use the Bottleweb framework with Bokeh to build custom Python web app bar charts.

Our Tools

This tutorial works with either Python 2 or 3, but Python 3 is strongly recommended for new applications. I used Python 3.6.2 while writing this post. In addition to Python throughout this tutorial we will also use the following application dependencies:

If you need help getting your development environment configured before running this code, take a look at this guide for setting up Python 3 and Bottle on Ubuntu 16.04 LTS.

All code in this blog post is available open source under the MIT license on GitHub under the bar-charts-bokeh-bottle-python-3 directory of the blog-code-examples repository. Use the source code as you want to for your own projects.

Installing Bottle and Bokeh

Create a new virtual environment for this project to isolate our dependencies using the following command in the terminal. I usually run the venv command within a separate venvs directory where all my virtualenvs are store.

python3 -m venv bottlechart

Activate the virtualenv.

source bottlechart/bin/activate

The command prompt will change after activating the virtualenv:

Activating our Python virtualenv for this project on the command line.

Keep in mind that you need to activate the virtualenv in every new terminal window where you want to use the virtualenv to run the project.

Bokeh and Bottle are installable into the now-activated virtualenv using pip. Run this command to get the appropriate Bokeh and Bottle versions.

pip install bokeh==0.12.6 bottle==0.12.13 pandas==0.20.3

Our required dependencies will be installed within our virtualenv after a brief download and installation period.

Installing collected packages: bottle, six, chardet, certifi, idna, urllib3, requests, PyYAML, python-dateutil, MarkupSafe, Jinja2, numpy, tornado, bkcharts, bokeh, pytz, pandas
  Running setup.py install for bottle ... done
  Running setup.py install for PyYAML ... done
  Running setup.py install for MarkupSafe ... done
  Running setup.py install for tornado ... done
  Running setup.py install for bkcharts ... done
  Running setup.py install for bokeh ... done
Successfully installed Jinja2-2.9.6 MarkupSafe-1.0 PyYAML-3.12 bkcharts-0.2 bokeh-0.12.6 bottle-0.12.13 certifi-2017.7.27.1 chardet-3.0.4 idna-2.5 numpy-1.13.1 pandas-0.20.3 python-dateutil-2.6.1 pytz-2017.2 requests-2.18.2 six-1.10.0 tornado-4.5.1 urllib3-1.22

We can now begin coding our web app.

Building the Bottle App

First we'll code a basic Bottle application and then we will add the bar charts to the rendered page.

Create a folder for your project named bottle-bokeh-charts. Within bottle-bokeh-charts create a new file named app.py with the following code:

importosimportbottlefrombottleimportroute,run,templateapp=bottle.default_app()TEMPLATE_STRING="""<html><head><title>Bar charts with Bottle and Bokeh</title></head><body><h1>Bugs found over the past {{ bars_count }} days</h1></body></html>"""@route('/<num_bars:int>/')defchart(num_bars):"""Returns a simple template stating the number of bars that should    be generated when the rest of the function is complete."""ifnum_bars<=0:num_bars=1returntemplate(TEMPLATE_STRING,bars_count=num_bars)if__name__=='__main__':run(host='127.0.0.1',port=8000,debug=False,reloader=True)

The code shown above provides a short Bottle application with a single route, defined with the chart function. chart receives an arbitrary integer value as input. The template function within chart uses the HTML template defined in TEMPLATE_STRING to render an HTML page as a response to incoming requests.

The last two lines in the allow us to run the Bottle application in debug mode on port 8000. Never use debug mode for production deployments!WSGI servers like Gunicorn are built for handling real traffic and will be easier to configure without major security holes.

We can now test out our application.

Make sure your virtualenv is still activated and that you are in the base directory of your project where app.py is located. Run app.py using the python command.

(bottlechart)$ python app.py

Go to localhost:8000/16/ in your web browser. You should see a header message about the number of bugs found over the past 16 days. However, there's no bar chart to accompany that message just yet.

A simple Bottle app without the bar chart.

Our single Bottle route is in place but it is not very exciting. Time to create a nice-looking bar chart.

Creating A Bar Chart with Bokeh

We'll build on our basic Bottle app foundation using some new Python code to engage the Bokeh library.

Open app.py back up and add the following highlighted import lines.

importosimportbottle~~importrandom~~frombokeh.modelsimport(HoverTool,FactorRange,Plot,LinearAxis,Grid,~~Range1d)~~frombokeh.models.glyphsimportVBar~~frombokeh.plottingimportfigure~~frombokeh.chartsimportBar~~frombokeh.embedimportcomponents~~frombokeh.models.sourcesimportColumnDataSourcefrombottleimportroute,run,template

The rest of our application will use these imports to generate random data and the bar chart.

Our bar chart will have "software bugs found" for its theme. The data will randomly generate each time the page is generated. In a real application you would of course likely have a more stable and useful data source.

Continue modifying app.py so the section after the imports looks like the following code.

app=bottle.default_app()TEMPLATE_STRING="""<html><head><title>Bar charts with Bottle and Bokeh</title>~~  <link href="http://cdn.pydata.org/bokeh/release/bokeh-0.12.6.min.css" ~~        rel="stylesheet">~~  <link href="http://cdn.pydata.org/bokeh/release/bokeh-widgets-0.12.6.min.css" ~~        rel="stylesheet"></head><body><h1>Bugs found over the past {{ bars_count }} days</h1>~~  {{ !the_div }}~~  <script src="http://cdn.pydata.org/bokeh/release/bokeh-0.12.6.min.js"></script>~~  <script src="http://cdn.pydata.org/bokeh/release/bokeh-widgets-0.12.6.min.js"></script>~~  {{ !the_script }}</body></html>"""@route('/<num_bars:int>/')defchart(num_bars):"""Returns a simple template stating the number of bars that should    be generated when the rest of the function is complete."""ifnum_bars<=0:num_bars=1~~data={"days":[],"bugs":[],"costs":[]}~~foriinrange(1,num_bars+1):~~data['days'].append(i)~~data['bugs'].append(random.randint(1,100))~~data['costs'].append(random.uniform(1.00,1000.00))~~hover=create_hover_tool()~~plot=create_bar_chart(data,"Bugs found per day","days",~~"bugs",hover)~~script,div=components(plot)~~returntemplate(TEMPLATE_STRING,bars_count=num_bars,~~the_div=div,the_script=script)

The chart function gains three new lists that are randomly generated by Python 3's super-handy random module.

chart calls two functions, create_hover_tool and create_bar_chart. We haven't written those functions yet, so let's do that now. Add these two new functions below the chart function, but before the if __name__ == '__main__': line.

defcreate_hover_tool():# we'll code this function in a momentreturnNonedefcreate_bar_chart(data,title,x_name,y_name,hover_tool=None,width=1200,height=300):"""Creates a bar chart plot with the exact styling for the centcom       dashboard. Pass in data as a dictionary, desired plot title,       name of x axis, y axis and the hover tool HTML."""source=ColumnDataSource(data)xdr=FactorRange(factors=data[x_name])ydr=Range1d(start=0,end=max(data[y_name])*1.5)tools=[]ifhover_tool:tools=[hover_tool,]plot=figure(title=title,x_range=xdr,y_range=ydr,plot_width=width,plot_height=height,h_symmetry=False,v_symmetry=False,min_border=10,toolbar_location="above",tools=tools,responsive=True,outline_line_color="#666666")glyph=VBar(x=x_name,top=y_name,bottom=0,width=.8,fill_color="#6599ed")plot.add_glyph(source,glyph)xaxis=LinearAxis()yaxis=LinearAxis()plot.add_layout(Grid(dimension=0,ticker=xaxis.ticker))plot.add_layout(Grid(dimension=1,ticker=yaxis.ticker))plot.toolbar.logo=Noneplot.min_border_top=0plot.xgrid.grid_line_color=Noneplot.ygrid.grid_line_color="#999999"plot.yaxis.axis_label="Bugs found"plot.ygrid.grid_line_alpha=0.1plot.xaxis.axis_label="Days after app deployment"plot.xaxis.major_label_orientation=1returnplot

That's a lot of new code. The create_hover_tool function does not do anything just yet other than returning. None, which is used when no hover tool is desired for the graph.

Within the create_bar_chart function we take in our randomly-generated data source and convert it into a ColumnDataSource object that is one type of input object we can pass to Bokeh functions. We specify two ranges for the chart's x and y axes.

The tools list will remain empty because we do not yet have a hover tool. A lot of the magic happens in the lines where we create plot using the figure function. We specify all the parameters we want our graph to have such as the size, toolbar, borders and whether or not the graph should be responsive upon changing the web browser size.

The VBar object creates vertical bars to add them to the plot with the add_glyph function.

The last lines of the function change the graph's appearance. For example, we took away the Bokeh logo by specifying plot.toolbar.logo = None and added labels to both axes. I recommend keeping the bokeh.plotting documentation open so you know what your options are for customizing the charts and visualizations.

Let's test our app by trying a 6-bar chart. The Bottle app should automatically reload when you save app.py with the new code. If you shut down the development server, start it back up using python app.py.

When you start up the development server you will receive the following warning because we are using the latest (at the time of this writing) 0.12.6 Bokeh release.

/Users/matt/Envs/bottlechart/lib/python3.6/site-packages/bokeh/util/deprecation.py:34: BokehDeprecationWarning: 
The bokeh.charts API has moved to a separate 'bkcharts' package.

This compatibility shim will remain until Bokeh 1.0 is released.
After that, if you want to use this API you will have to install
the bkcharts package explicitly.

Eventually a separate bkcharts project will be required but for now we can keep our code as is.

Open your browser to localhost:8000/6/.

Responsive Bokeh bar chart with 6 bars.

That one looks a bit sparse, so we can crank it up by 3x to 18 bars by going to localhost:5000/18/.

Responsive Bokeh bar chart with 18 bars.

Now another 5x to 90 bars with localhost:5000/90/.

Responsive Bokeh bar chart with 90 bars.

Looking good so far! What about that hover tool we skipped over though? We can add the hover tool with just a few more lines of code in the create_hover_tool function.

Creating a Hover Tool

Add these highlighted lines to app.py within the create_hover_tool function.

defcreate_hover_tool():~~"""Generates the HTML for the Bokeh's hover data tool on our graph."""~~hover_html="""~~      <div>~~        <span class="hover-tooltip">$x</span>~~      </div>~~      <div>~~        <span class="hover-tooltip">@bugs bugs</span>~~      </div>~~      <div>~~        <span class="hover-tooltip">$@costs{0.00}</span>~~      </div>~~    """~~returnHoverTool(tooltips=hover_html)

Embedding HTML within your Python application isn't usually a great idea but it works for small snippets like this hover tool. The hover tool uses $x to show the bar's x axis, @bugs to show the "bugs" field from our data source, and $@costs{0.00} to show the "costs" field formatted as a dollar amount with exactly 2 decimal places.

Ensure that you changed return None to return HoverTool(tooltips=hover_html) in your function so the results of the new code are reflected in the refreshed graph.

Go back to the browser and reload the localhost:8000/122/ page.

Responsive Bokeh bar chart with 122 bars.

Well done! Try playing around with the number of bars in the URL and the window size to see what the graph looks like under different conditions.

The chart gets crowded with more than 100. However, you can try to create as many bars as you want if your computer can handle the rendering. This screenshot shows what the completely impactical amount of 40,000 bars looks like:

Responsive Bokeh bar chart with 40000 bars.

You may need to do some more work to get the chart to be useful for displaying more than a couple hundred bars at a time.

What now?

We created a nice little configurable bar chart using the Bokeh code library.

Next you can change the input data source, work with other types of charts or modify the chart color scheme.

There is a lot more than Bokeh can do. Take a look at the official project documentation , GitHub repository, the Full Stack Python Bokeh page or take a look at other topics on Full Stack Python.

Questions? Let me know via a GitHub issue ticket on the Full Stack Python repository, on Twitter @fullstackpython or @mattmakai.

Do you see something wrong in this blog post? Fork this page's source on GitHub and submit a pull request with a fix.

Calvin Spealman: I Learned 4 Things From my First Ludum Dare

$
0
0
I've done my first Ludum Dare Jam now, and actually my first game jam of any kind. Wow! I am so happy to have finally done this. It was a super rewarding experience and I want to share that, and my game, with as many people as will listen.

My game is Patient Out Of Time. It is an apocalyptic moody shooter about a doctor salvaging power sources from robots in the wasteland to keep the life support of his last patient running as long as possible. The hospital staff have all left, and they are the only two survivors. Keeping this man alive is all this one doctor has to keep him going.

It is a sad game, but it was also a lot of fun to make.


Here are some things I learned this time. I hope to learn more things the next Ludum Dare.

Little Steps Make Safe Steps

I didn't have time for broken builds or half-built code I needed to fight my way back out of just to get the game running again. Every change I made had to be broken down into tiny, discrete non-breaking changes. Every step of way had to be playable. This kept the game constantly in a "technically releaseable" state, which kept stress about finishing the game off my back.

Refactoring Can Be Treading Water

My habits as a developer tend towards building systems. Now, I get a lot of enjoyment out of this and preach the merits of systems as code design, but I'm trying to learn to cautiously apply this form of what is, some times, over thinking things. So, I did my best to permit myself to write "bad" code and move forward.

I didn't have a lot of assets, so as I added them one by one through the process I never built any kind of asset management. That's what old Calvin would have done. You know, to "clean it up". Instead, I just added what I needed to make the new thing work, because spending time to change big things would do two negative things:

First, it would violate the first rule: Little Steps Make Safe Steps. Refactoring is a great way to get lost in the weeds with a half-completed bit of work that'll take you hours just to get the feature set back to exactly where you started. No thank you.

Compromise When You Find a Dead End

A lot of problems we come up against as software developments make the little voice in our heads say "Oh, I know, I'll just..." and then, hours later, we're still struggling with all the pitfalls and unforeseen problems with what we thought would be a totally simple solution.

When you see this, don't forget that you can give up. And I mean that in a good way, because some times it just isn't worth it.

As an example from Patient Out Of Time, I wanted to make the robots chasing you avoid the problem of "clumping" too close, which was common since they all just headed straight towards you. I started experimenting and thinking about different kind of flocking algorithms and coordination between the robots. It was all turning pretty complicated!

Instead, I backed out of all that and just randomized all their speeds a little bit. Problem solved with one line.

Add a Little Bit Of Everything

I had 48 hours. Technically, I had 72 hours, because I'm doing the Jam and not the Compo. However, I do have to work on Monday! And I have a family, and I try to avoid burn out. So, really, my time to put into this was pretty limited. Still, watching the clock, I was sure to rotate my efforts between code and art and audio and design.

Evenly distributing the effort across the different pieces that make the title contributed to that "always releaseable" goal. I didn't wait until the very end to figure out sound. I iterated on my art and animations interlaced with feature tweaks and bug fixes. Everything grew up together.

This also meant I got practice and new experience with everything. I did some audio sample editing. I worked on my pixel art animation skills. My skills with the Love2D platform I've been using were improved a bit. Every muscle got a little exercise.

Have Fun

I highly recommend trying out Ludum Dare some time. If you do, don't take it too seriously. Have fun!

tryexceptpass: Controlling Python Async Creep

$
0
0
Photo Credit: Christian Jourdy via Unsplash

Python added formal asynchronicity in the base language a while ago. It’s fun to play with asyncio tasks and coroutines, the basic constructs that execute almost in parallel. But as you start to integrate more with a regular codebase, you may find that things can get tricky. Especially if you’re forced to interact with synchronous code.

The complication arises when invoking awaitable functions. Doing so requires an async defined code block or coroutine. A non-issue except that if your caller has to be async, then you can’t call it either unless its caller is async. Which then forces its caller into an async block as well, and so on. This is “async creep”.

It can escalate fast, finding its way into all corners of your code. Not a big deal if the codebase is asynchronous, but can impede development when mixing it up.

Following are the two main mechanisms I use to work around this. Both assume we’re building an application that benefits from asynchronous execution.

Waiting for blocks of async code

Whether building an asynchronous application or enhancing a linear one, it’s important to determine the sections that will gain the most from async execution. This is usually not hard to answer, but no one else can do it for you. The general guideline is to start with things that wait on I/O, like file or socket access, HTTP requests, etc.

Once you know which pieces to optimize, start identifying the ones that can run on top of each other. The more you can group together, the better. A great example is code that needs information from several REST APIs that don’t depend on each other. You can use aiohttp and make all the calls in parallel instead of waiting for each one to finish before getting the next one.

Now it’s a matter of loading up those blocks of code into the main event loop. There’s a few ways of doing that, I like putting them into async functions and using asyncio.ensure_future() to put them in the loop and loop.run_until_complete() to wait for completion:

import asyncio
import aiohttp
async def fetch(url):
response = await aiohttp.request('GET', url)
return await response.text()
loop = asyncio.get_event_loop()
loop.run_until_complete(asyncio.gather(
asyncio.ensure_future(fetch("http://www.google.com")),
asyncio.ensure_future(fetch("http://www.github.com")),
asyncio.ensure_future(fetch("http://www.reddit.com"))
))

This is a similar example to one I used in a previous article: Threaded Asynchronous Magic and How to Wield it.

asyncio.ensure_future() turns the functions into coroutines, asyncio.gather() groups them together, while loop.run_until_complete() blocks execution until all calls complete. The output of this is a list with the results from each call.

Following the points discussed so far will produce code that runs synchronous blocks. But some of those blocks will execute several asynchronous functions together.

Use a thread

Also discussed in my earlier article, it’s not hard to create a separate thread that operates as a worker. It runs its own event loop and you use thread-safe asyncio methods to give it work. The nice part is you can give it synchronous work with call_soon() or async work with run_coroutine_threadsafe().

from threading import Thread
...
def start_background_loop(loop):
asyncio.set_event_loop(loop)
loop.run_forever()
# Create a new loop
new_loop = asyncio.new_event_loop()
# Assign the loop to another thread
t = Thread(target=start_background_loop, args=(new_loop,))
t.start()
# Give it some async work
future = asyncio.run_coroutine_threadsafe(
fetch("http://www.google.com"),
new_loop
)
# Wait for the result
print(future.result())
# Do it again but with a callback
asyncio.run_coroutine_threadsafe(
fetch("http://www.github.com"),
new_loop
).add_done_callback(lambda future: print(future.result()))

We get a Future back from run_coroutine_threadsafe which we can wait on using the result(timeout) method, or add a callback with add_done_callback(function). The callback function will receive the future as an argument.

Supporting both async and sync calls in the same API methods

Let’s look at something more complicated. What if you have a library or module where most functions can run in parallel, but you only want to do so if the caller is async?

We can take advantage of the threaded model here because the scheduler methods are synchronous. Meaning that your user doesn’t need to declare itself as async and have to deal with the async creep in their code. Asynchronous blocks remain contained to your module.

It also allows for api interfaces that can choose whether to use asyncio or not. In fact, we can even go one step further and auto-detect when to be async using some inspect magic.

Without threads you have no control over your event loop. Users could do their own async fiddling that interferes with how your methods execute. The thread will at least guarantee asynchronous execution inside an event loop that you operate. One that you start and stop when needed. This leads to more predictable, repeatable results.

Let’s look at an example that builds on the earlier ones. Here we make a wrapper method that calls the appropriate sync or async function based on its caller.

import inspect
import requests
...
def is_async_caller():
"""Figure out who's calling."""
    # Get the calling frame
caller = inspect.currentframe().f_back.f_back
    # Pull the function name from FrameInfo
func_name = inspect.getframeinfo(caller)[2]
    # Get the function object
f = caller.f_locals.get(
func_name,
caller.f_globals.get(func_name)
)
    # If there's any indication that the function object is a 
# coroutine, return True. inspect.iscoroutinefunction() should
# be all we need, the rest are here to illustrate.
    if any([inspect.iscoroutinefunction(f),
inspect.isgeneratorfunction(f),
inspect.iscoroutine(f), inspect.isawaitable(f),
inspect.isasyncgenfunction(f) , inspect.isasyncgen(f)]):
return True
else:
return False
def fetch(url):
"""GET the URL, do it asynchronously if the caller is async"""

# Figure out which function is calling us
if is_async_caller():
print("Calling ASYNC method")
        # Run the async version of this method and
# print the result with a callback
asyncio.run_coroutine_threadsafe(
_async_fetch(url),
new_loop
).add_done_callback(lambda f: print(f.result()))
    else:
print("Calling BLOCKING method")
        # Run the synchronous version and print the result
print(_sync_fetch(url))
def _sync_fetch(url):
"""Blocking GET"""
    return requests.get(url).content
async def _async_fetch(url):
"""Async GET"""
    resp = await aiohttp.request('GET', url)
return await resp.text()
def call_sync_fetch():
"""Blocking fetch call"""
    fetch("http://www.github.com")
async def call_async_fetch():
"""Asynchronous fetch call (no different from sync call
except this function is defined async)"""
    fetch("http://www.github.com")
# Perform a blocking GET
call_sync_fetch()
# Perform an async GET
loop = asyncio.get_event_loop()
loop.run_until_complete(call_async_fetch())

We’re using inspect in is_async_caller() to get the function object that called us and determine whether its a coroutine or not. While this is fancy and illustrates the possibilities, it may not be very performant. We could easily replace the mechanism with an async_execute argument in the fetch wrapper and have the user decide.

The call_sync_fetch and call_async_fetch functions are there to show how a user could go about calling our wrapper. As you can see, there’s no need to await the fetch call because it’s done automatically by running in a separate thread.

This could prove useful to any python packages that are wanting to add support for asynchronous execution while still supporting legacy code. I’m sure there are pros and cons, feel free to start the discussion in the comments below.

If you liked this article and want to keep up with what I’m working on, please click the heart below to recommend it, and follow me on Twitter.


Controlling Python Async Creep was originally published in Hacker Noon on Medium, where people are continuing the conversation by highlighting and responding to this story.

Reuven Lerner: Where can you practice (and improve) your Python skills?

$
0
0

The most common question I get from students in my Python classes is: How can we practice and improve our skills after the course is over?

These students realize that no matter how good a course might be, they won’t retain very much if they don’t use and practice their Python on a regular basis.

I’ve thus created PracticeYourPython.com, a site listing all of the resources I know about that are designed to improve your Python skills.  Some of these are free, and others are paid.  (And yes, I’ve included resources that I’ve created, as well, such as Practice Makes Python and Weekly Python Exercise.)

So if you want to improve your Python skills, head over to PracticeYourPython.com!  And if you know of resources I’ve missed, please drop me a line at reuven@lerner.co.il; I’ll be sure to add it.

The post Where can you practice (and improve) your Python skills? appeared first on Lerner Consulting Blog.


Talk Python to Me: #123 Lessons from 100 straight dev job interviews

$
0
0
What if you could take the experience and insight from 100 job interviews and use them to find just the right job. You'd be able to weed out the bad places that are not the right fit. You'd see that low-ball offer coming a mile away and move right along. <br/> <br/> But, no one could really do 100 consecutive interviews, right? That'd be a full-time job in and of itself! <br/> <br/> You'll meet Susan Tan who did just that.<br/> <br/> Links from the show:<br/> <br/> <div style="font-size: .85em;"><b>Susan on Twitter</b>: <a href="https://twitter.com/ArcTanSusan" target="_blank">@ArcTanSusan</a><br/> <b>Video presentation at PyCon 2017</b>: <a href="https://www.youtube.com/watch?v=uzz5AaCWMps" target="_blank">youtube.com/watch?v=uzz5AaCWMps</a><br/> <b>Susan's job_applicant_resources.md</b>: <a href="https://gist.github.com/ArcTanSusan/df4fc56cd24ab2720c509305d728e866" target="_blank">gist.github.com</a><br/></div>

Chris Moffitt: Pandas Grouper and Agg Functions Explained

$
0
0

Introduction

Every once in a while it is useful to take a step back and look at pandas’ functions and see if there is a new or better way to do things. I was recently working on a problem and noticed that pandas had a Grouper function that I had never used before. I looked into how it can be used and it turns out it is useful for the type of summary analysis I tend to do on a frequent basis.

In addition to functions that have been around a while, pandas continues to provide new and improved capabilities with every release. The updated agg function is another very useful and intuitive tool for summarizing data.

This article will walk through how and why you may want to use the Grouper and agg functions on your own data. Along the way, I will include a few tips and tricks on how to use them most effectively.

Grouping Time Series Data

Pandas’ origins are in the financial industry so it should not be a surprise that it has robust capabilities to manipulate and summarize time series data. Just look at the extensive time series documentation to get a feel for all the options. I encourage you to review it so that you’re aware of the concepts.

In order to illustrate this particular concept better, I will walk through an example of sales data and some simple operations to get total sales by month, day, year, etc.

For this example, I’ll use my trusty transaction data that I’ve used in other articles. You can follow along in the notebook as well.

importpandasaspddf=pd.read_excel("https://github.com/chris1610/pbpython/blob/master/data/sample-salesv3.xlsx?raw=True")df["date"]=pd.to_datetime(df['date'])df.head()
account numbernameskuquantityunit priceext pricedate
0740150Barton LLCB1-200003986.693380.912014-01-01 07:21:51
1714466Trantow-BarrowsS2-77896-163.16-63.162014-01-01 10:00:47
2218895Kulas IncB1-699242390.702086.102014-01-01 13:24:58
3307599Kassulke, Ondricka and MetzS1-654814121.05863.052014-01-01 15:05:22
4412290Jerde-HilpertS2-34077683.21499.262014-01-01 23:26:55

Before I go much further, it’s useful to become familiar with Offset Aliases. These strings are used to represent various common time frequencies like days vs. weeks vs. years. I always forget what these are called and how to use the more esoteric ones so make sure to bookmark the link!

For example, if you were interested in summarizing all of the sales by month, you could use the resample function. The tricky part about using resample is that it only operates on an index. In this data set, the data is not indexed by the date column so resample would not work without restructuring the data. In order to make it work, use set_index to make the date column an index and then resample:

df.set_index('date').resample('M')["ext price"].sum()
date
2014-01-31    185361.66
2014-02-28    146211.62
2014-03-31    203921.38
2014-04-30    174574.11
2014-05-31    165418.55
2014-06-30    174089.33
2014-07-31    191662.11
2014-08-31    153778.59
2014-09-30    168443.17
2014-10-31    171495.32
2014-11-30    119961.22
2014-12-31    163867.26
Freq: M, Name: ext price, dtype: float64

This is a fairly straightforward way to summarize the data but it gets a little more challenging if you would like to group the data as well. If we would like to see the monthly results for each customer, then you could do this (results truncated to 20 rows):

df.set_index('date').groupby('name')["ext price"].resample("M").sum()
name                             date
Barton LLC                       2014-01-31     6177.57
                                 2014-02-28    12218.03
                                 2014-03-31     3513.53
                                 2014-04-30    11474.20
                                 2014-05-31    10220.17
                                 2014-06-30    10463.73
                                 2014-07-31     6750.48
                                 2014-08-31    17541.46
                                 2014-09-30    14053.61
                                 2014-10-31     9351.68
                                 2014-11-30     4901.14
                                 2014-12-31     2772.90
Cronin, Oberbrunner and Spencer  2014-01-31     1141.75
                                 2014-02-28    13976.26
                                 2014-03-31    11691.62
                                 2014-04-30     3685.44
                                 2014-05-31     6760.11
                                 2014-06-30     5379.67
                                 2014-07-31     6020.30
                                 2014-08-31     5399.58
Name: ext price, dtype: float64

This certainly works but it feels a bit clunky. Fortunately Grouper makes this a little more streamlined. Instead of having to play around with reindexing, we can use our normal groupby syntax but provide a little more info on how to group the data in the date column:

df.groupby(['name',pd.Grouper(key='date',freq='M')])['ext price'].sum()
name                             date
Barton LLC                       2014-01-31     6177.57
                                 2014-02-28    12218.03
                                 2014-03-31     3513.53
                                 2014-04-30    11474.20
                                 2014-05-31    10220.17
                                 2014-06-30    10463.73
                                 2014-07-31     6750.48
                                 2014-08-31    17541.46
                                 2014-09-30    14053.61
                                 2014-10-31     9351.68
                                 2014-11-30     4901.14
                                 2014-12-31     2772.90
Cronin, Oberbrunner and Spencer  2014-01-31     1141.75
                                 2014-02-28    13976.26
                                 2014-03-31    11691.62
                                 2014-04-30     3685.44
                                 2014-05-31     6760.11
                                 2014-06-30     5379.67
                                 2014-07-31     6020.30
                                 2014-08-31     5399.58
Name: ext price, dtype: float64

Since groupby is one of my standard functions, this approach seems simpler to me and it is more likely to stick in my brain.

The nice benefit of this capability is that if you are interested in looking at data summarized in a different time frame, just change the freq parameter to one of the valid offset aliases. For instance, an annual summary using December as the last month would look like this:

df.groupby(['name',pd.Grouper(key='date',freq='A-DEC')])['ext price'].sum()
name                             date
Barton LLC                       2014-12-31    109438.50
Cronin, Oberbrunner and Spencer  2014-12-31     89734.55
Frami, Hills and Schmidt         2014-12-31    103569.59
Fritsch, Russel and Anderson     2014-12-31    112214.71
Halvorson, Crona and Champlin    2014-12-31     70004.36
Herman LLC                       2014-12-31     82865.00
Jerde-Hilpert                    2014-12-31    112591.43
Kassulke, Ondricka and Metz      2014-12-31     86451.07
Keeling LLC                      2014-12-31    100934.30
Kiehn-Spinka                     2014-12-31     99608.77
Koepp Ltd                        2014-12-31    103660.54
Kuhn-Gusikowski                  2014-12-31     91094.28
Kulas Inc                        2014-12-31    137351.96
Pollich LLC                      2014-12-31     87347.18
Purdy-Kunde                      2014-12-31     77898.21
Sanford and Sons                 2014-12-31     98822.98
Stokes LLC                       2014-12-31     91535.92
Trantow-Barrows                  2014-12-31    123381.38
White-Trantow                    2014-12-31    135841.99
Will LLC                         2014-12-31    104437.60
Name: ext price, dtype: float64

If your annual sales were on a non-calendar basis, then the data can be easily changed by modifying the freq parameter. I encourage you to play around with different offsets to get a feel for how it works. When dealing with summarizing time series data, this is incredibly handy. To put this in perspective, try doing this in Excel. It is certainly possible (using pivot tables and custom grouping) but I do not think it is nearly as intuitive as the pandas approach.

New and improved aggregate function

In pandas 0.20.1, there was a new agg function added that makes it a lot simpler to summarize data in a manner similar to the groupbyAPI.

To illustrate the functionality, let’s say we need to get the total of the ext price and quantity column as well as the average of the unit price . The process is not very convenient:

df[["ext price","quantity"]].sum()
ext price    2018784.32
quantity       36463.00
dtype: float64
df["unit price"].mean()
55.007526666666664

This works but it’s a bit messy. The new agg makes this simpler:

df[["ext price","quantity","unit price"]].agg(['sum','mean'])
ext pricequantityunit price
sum2.018784e+0636463.00000082511.290000
mean1.345856e+0324.30866755.007527

The results are good but including the sum of the unit price is not really that useful. Fortunately we can pass a dictionary to agg and specify what operations to apply to each column.

df.agg({'ext price':['sum','mean'],'quantity':['sum','mean'],'unit price':['mean']})
quantityext priceunit price
mean24.3086671.345856e+0355.007527
sum36463.0000002.018784e+06NaN

I find this approach really handy when I want to summarize several columns of data. In the past, I would run the individual calculations and build up the resulting dataframe a row at a time. It was tedious. This is a much better approach.

As an added bonus, you can define your own functions. For instance, I frequently find myself needing to aggregate data and use a mode function that works on text. I found a lambda function that uses value_counts to do what I need and frequently use this get_max function:

get_max=lambdax:x.value_counts(dropna=False).index[0]

Then, if I want to include the most frequent sku in my summary table:

df.agg({'ext price':['sum','mean'],'quantity':['sum','mean'],'unit price':['mean'],'sku':[get_max]})
quantityskuext priceunit price
<lambda>NaNS2-77896NaNNaN
mean24.308667NaN1.345856e+0355.007527
sum36463.000000NaN2.018784e+06NaN

This is pretty cool but there is one thing that has always bugged me about this approach. The fact that the column says “<lambda>” bothers me. Ideally I want it to say “most frequent.” In the past I’d jump through some hoops to rename it. But, when working on this article I stumbled on another approach - explicitly defining the name of the lambda function.

get_max.__name__="most frequent"

Now, when I do the aggregation:

df.agg({'ext price':['sum','mean'],'quantity':['sum','mean'],'unit price':['mean'],'sku':[get_max]})
quantityskuext priceunit price
most frequentNaNS2-77896NaNNaN
mean24.308667NaN1.345856e+0355.007527
sum36463.000000NaN2.018784e+06NaN

I get a much nicer label! It’s a small thing but I am definitely glad I finally figured that out.

As a final final bonus, here’s one other trick. The aggregate function using a dictionary is useful but one challenge is that it does not preserve order. If you want to make sure your columns are in a specific order, you can use an OrderedDict :

importcollectionsf=collections.OrderedDict([('ext price',['sum','mean']),('quantity',['sum','mean']),('sku',[get_max])])df.agg(f)
ext pricequantitysku
mean1.345856e+0324.308667NaN
most frequentNaNNaNS2-77896
sum2.018784e+0636463.000000NaN

Conclusion

The pandas library continues to grow and evolve over time. Sometimes it is useful to make sure there aren’t simpler approaches to some of the frequent approaches you may use to solve your problems. Pandas’ Grouper function and the updated agg function are really useful when aggregating and summarizing data. I hope this article will be useful to you in your data analysis. Are there any other pandas functions that you just learned about or might be useful to others? Feel free to give your input in the comments.

Doug Hellmann: sqlite3 — Embedded Relational Database — PyMOTW 3

$
0
0
The sqlite3 module provides a DB-API 2.0 compliant interface to SQLite, an in-process relational database. SQLite is designed to be embedded in applications, instead of using a separate database server program such as MySQL, PostgreSQL, or Oracle. It is fast, rigorously tested, and flexible, making it suitable for prototyping and production deployment for some applications. … Continue reading sqlite3 — Embedded Relational Database — PyMOTW 3

Weekly Python Chat: PyCon Australia

$
0
0

Want to ask a question of PyCon Australia attendees? Curious what the conferences is like and what we've been doing there?

I'll be holding a live chat with the friendly folks I meet at PyCon Australia.

Continuum Analytics News: What’s New with Anaconda in 2017?

$
0
0
Monday, July 31, 2017
Scott Collison
Chief Executive Officer

It’s hard to believe that we’re halfway through 2017. I joined Anaconda as CEO back in January and I’ve been deeply impressed by this amazing team and all that we have collectively accomplished in just six short months. From new events to new products, our teams have already squeezed quite a bit into 2017. Before the year flies by completely, I wanted to take a moment to reflect and share the exciting milestones we’ve hit on the road to 2018.

New Senior Leadership Team Members

Here at Anaconda, the first half of the year was bookended by new hires. At the beginning of the year, I joined to run the company. This move allowed Anaconda’s co-founder, Travis Oliphant, to channel his energy into open source innovation and community. At the end of June, we added another new name to the executive team when Aaron Barfoot came on-board as CFO. Aaron is a world class CFO and is leading the effort to make our finance, IT and HR departments top notch. Both Aaron and I are thrilled to be a part of the next chapter for Anaconda as our numbers continue to climb past four million active users.

New Data

One of Anaconda’s most exciting projects this year was the release of our data-backed report: Winning at Data Science: How Teamwork Leads to Victory. Working with the independent research firm Vanson Bourne, we surveyed 200 data science and analytics decision makers, digging into the adoption, challenges and value of data science in the enterprise. While some of the findings were expected, others were jaw dropping. For example, 96 percent of respondents agree that data science is critical to the success of their organization, but 22 percent are failing to fully take advantage of their data. If you love numbers as much as we do, check out the full findings here.

New Events

This February, our inaugural user conference, AnacondaCON was a box office hit. Literally.

I’ve been at companies known for their stand-out conferences, and this is one of the best industry conferences I have ever attended, by far. 

With speakers from the Anaconda team, our customers/users and partners, it was fantastic to have the brightest minds in data science together in the same room. If you couldn’t make it to this year’s event, you can watch the 2017 keynotes and keep your eye out for updates for AnacondaCON 2018, which will be April 8-11, 2018 at the JW Marriott in Austin, TX.

New Partners

In April, we joined forces with IBM to offer Anaconda on IBM’s Cognitive Systems, the company’s deep learning platform, as well as the IBM Power AI software distribution for machine learning. In May, we made another big announcement with our partners H20.ai and MapD Technologies with the launch of the GPU Open Analytics Initiative (GOAI). GOAI is designed to create common data frameworks using NVIDIA’s technology, accelerating data science on GPUs. We see both of these partnerships as major points of validation for data science and machine learning, as data scientists continue to stretch their legs in the enterprise. Keep an eye out for even more activity in this area later in the year.

New Products

If you’re an Anaconda user, we hope you were as thrilled as we were about the launch of Anaconda 4.4 this June. Besides delivering a comprehensive platform for Python-centric data science with a single-click installer, Anaconda 4.4 is designed to simplify working with Python 2 and Python 3 code, supporting a gradual migration and avoiding the need for any “big bang” cutover.

New Users

In 2016 alone, Anaconda user growth products and services grew more than 100 percent. In 2017, the number of downloads-to-date has surpassed 25 million with more than four million active users, since the company’s founding in 2012. A recent poll from KDnuggets found that Anaconda usage has increased 37% since 2016, placing the platform in the top 10 ranking for the industry’s most popular analytics/data science tools. The poll also found that Python has overtaken R as the most popular data science language, a trend we anticipate will continue in the years ahead.

I’m super pleased with our accomplishments for the first half of the year and look forward to exciting second half of 2017!

Viewing all 24375 articles
Browse latest View live


<script src="https://jsc.adskeeper.com/r/s/rssing.com.1596347.js" async> </script>