In this episode, we worked on Postgres database backups and modified the backup tool, wal-e, to use the Shiv app format.
wal-e is Postgres database backup tool that works by managing the Write-Ahead Log (WAL) that a Postgres database produces. The WAL is the log of recent changes that happened in the database. If you have access to a full WAL, then you can conceivably reproduce a Postgres database’s data.
↧
Matt Layman: wal-e Postgres Backups - Building SaaS #32
↧
Continuum Analytics Blog: Machine Learning in Healthcare: 5 Use Cases that Improve Patient Outcomes
Machine learning is accelerating the pace of scientific discovery across fields, and medicine is no exception. From language processing tools that accelerate research to predictive algorithms that alert medical staff of an impending heart attack,…
The post Machine Learning in Healthcare: 5 Use Cases that Improve Patient Outcomes appeared first on Anaconda.
↧
↧
Mike Driscoll: Rotating Images in ReportLab
There are times when you want to rotate images or other objects in ReportLab while creating a PDF. For example, you might want to rotate an image by 45 degrees for watermarking purposes. Or you might need an image that runs vertically along one of the edges of the PDF.
You can rotate images by using ReportLab’s canvas methods or by using its higher level Flowables that you can find in the platypus. module. Let’s start by looking at how to do this with the canvas directly!
Rotating Images Using Canvas
Rotating images using the canvas is kind of confusing. The reason being that when you rotate the canvas, you may end up inadvertently rotating other elements on your canvas if you’re not careful.
Let’s take a look at the code:
# image_on_canvas.py
from reportlab.libimport utils
from reportlab.lib.pagesizesimport letter
from reportlab.pdfgenimport canvas


def add_image(image_path):
    img = utils.ImageReader(image_path)
    img_width, img_height = img.getSize()
    aspect = img_height / float(img_width)
    my_canvas = canvas.Canvas("canvas_image.pdf",
                              pagesize=letter)
    my_canvas.saveState()
    my_canvas.rotate(45)
    my_canvas.drawImage(image_path, 150, 10,
                        width=100, height=(100* aspect))
    my_canvas.restoreState()
    my_canvas.save()
if __name__ == '__main__':
    image_path = 'snakehead.jpg'
    add_image(image_path)
Here you use ReportLab’s utils function to extract the image’s width and height. Then you create the canvas and save its current state. This will allow you to modify the canvas from this point forward and then restore it later. If you’d like to have some text or shapes before the rotated image, you would put that code before the call to saveState().
After saving the canvas state, you can use the canvas’s rotate() method to rotate the canvas 45 degrees. Then you draw the image to the canvas. Finally you use restoreState() to restore the state back to what it was before you rotated it.
Note: When rotating the canvas, the x/y position is now at a 45 degree angle, so you will have to take that into account while positioning the image on your canvas.
When I ran this code, I ended up with a document that looked like this:
You can also download the PDF here.
Now let’s find out how to do the same thing using a Flowable!
Rotating Images Using the Image Flowable
Flowables are objects in ReportLab that come from their platypus module, which stands for Page Layout and Typography Using Scripts. This module is basically a high-level interface to the canvas methods that abstracts the drawing bits away and makes creating multipage documents much simpler.
The quickest way to create a rotated image using a Flowable in ReportLab is to subclass the Image Flowable. Let’s take a look!
from reportlab.lib.pagesizesimport letter
from reportlab.platypusimport Image, SimpleDocTemplate

class RotatedImage(Image):

    def wrap(self, availWidth, availHeight):
        height, width = Image.wrap(self, availHeight, availWidth)return width, height

    def draw(self):
        self.canv.rotate(45)
        Image.draw(self)
doc = SimpleDocTemplate("image_with_rotation.pdf", pagesize=letter)
flowables = []
img = RotatedImage('snakehead.jpg',
                   width=50, height=50)
img.hAlign = 'CENTER'
flowables.append(img)
doc.build(flowables)
Here you subclass Image and override the wrap() and draw() methods. The main piece that you will care about is in the draw() method where you call self.canv.rotate(45). The Image class has its own canvas in it that you can manipulate. In this case, you tell it that you want to always draw the image at a 45 degree angle.
Next you create a document template and create an instance of RotatedImage. Then you tell the image to be centered on the page. Finally you build() the document.
When you run this code, you should see the following:
You can get the actual PDF here if you’d rather see the file.
Wrapping Up
Now you know how to rotate images using ReportLab. You learned how to rotate an image using the low-level canvas methods and you also learned how to rotate an Image Flowable. You can use this knowledge to rotate other kinds of objects as well. For example, you can rotate text and shapes using the same methodology. You will always be rotating the canvas to get the needed effect. Have fun and happy coding!
 | Want to learn more about working with PDFs in Python? Then check out my book: ReportLab: PDF Processing with Python |
Related Reading
- A Simple Step-by-Step Reportlab Tutorial
- Creating Interactive PDF Forms in ReportLab with Python
- ReportLab: Adding a Chart to a PDF with Python
The post Rotating Images in ReportLab appeared first on The Mouse Vs. The Python.
↧
Data School: Learn a new pandas trick every day!
Every weekday, I share a new "pandas trick" on social media. Each trick takes only a minute to read, yet you'll learn something new that will save you time and energy in the future!
Here's my latest trick:
🐼🤹♂️ pandas trick:
— Kevin Markham (@justmarkham) September 4, 2019
Want to combine the output of an aggregation with the original DataFrame?
Instead of: df.groupby('col1').col2.func()
Use: df.groupby('col1').col2.transform(func)
"transform" changes the output shape
See example 👇#Python#DataScience#pandas#pandastrickspic.twitter.com/9dkcAGpTYK
Want to read the 59 tricks that I've already posted? See below 👇
Want to see the daily trick in your social media feed? Follow me on Twitter, Facebook, LinkedIn, and YouTube
Want to watch a live demo of my top 25 tricks?Watch this video🎥
Want to support daily pandas tricks? Become a Data School Insider🙏
Categories
- Reading files
- Creating example DataFrames
- Renaming columns
- Selecting rows and columns
- Filtering rows by condition
- Manipulating strings
- Working with data types
- Encoding data
- Extracting data from lists
- Working with time series data
- Handling missing values
- Using aggregation functions
- Random sampling
- Merging DataFrames
- Styling DataFrames
- Exploring a dataset
- Other
Reading files
🐼🤹♂️ pandas trick:
— Kevin Markham (@justmarkham) August 19, 2019
5 useful "read_csv" parameters that are often overlooked:
➡️ names: specify column names
➡️ usecols: which columns to keep
➡️ dtype: specify data types
➡️ nrows: # of rows to read
➡️ na_values: strings to recognize as NaN#Python#DataScience#pandastricks
🐼🤹♂️ pandas trick:
— Kevin Markham (@justmarkham) September 3, 2019
⚠️ Got bad data (or empty rows) at the top of your CSV file? Use these read_csv parameters:
➡️ header = row number of header (start counting at 0)
➡️ skiprows = list of row numbers to skip
See example 👇#Python#DataScience#pandas#pandastrickspic.twitter.com/t1M6XkkPYG
🐼🤹♂️ pandas trick:
— Kevin Markham (@justmarkham) June 21, 2019
Two easy ways to reduce DataFrame memory usage:
1. Only read in columns you need
2. Use 'category' data type with categorical data.
Example:
df = https://t.co/Ib52aQAdkA_csv('file.csv', usecols=['A', 'C', 'D'], dtype={'D':'category'})#Python#pandastricks
🐼🤹♂️ pandas trick:
— Kevin Markham (@justmarkham) July 4, 2019
You can read directly from a compressed file:
df = https://t.co/Ib52aQAdkA_csv('https://t.co/3JAwA8h7FJ')
Or write to a compressed file:https://t.co/ySXYEf6MjY_csv('https://t.co/3JAwA8h7FJ')
Also supported: .gz, .bz2, .xz#Python#pandas#pandastricks
🐼🤹♂️ pandas trick:
— Kevin Markham (@justmarkham) June 20, 2019
Are your dataset rows spread across multiple files, but you need a single DataFrame?
Solution:
1. Use glob() to list your files
2. Use a generator expression to read files and concat() to combine them
3. 🥳
See example 👇#Python#DataScience#pandastrickspic.twitter.com/qtKpzEoSC3
🐼🤹♂️ pandas trick:
— Kevin Markham (@justmarkham) July 15, 2019
Need to quickly get data from Excel or Google Sheets into pandas?
1. Copy data to clipboard
2. df = https://t.co/Ib52aQAdkA_clipboard()
3. 🥳
See example 👇
Learn 25 more tips & tricks: https://t.co/6akbxXG6SI#Python#DataScience#pandas#pandastrickspic.twitter.com/M2Yw0NAXRe
Creating example DataFrames
🐼🤹♂️ pandas trick:
— Kevin Markham (@justmarkham) June 28, 2019
Need to create an example DataFrame? Here are 3 easy options:
pd.DataFrame({'col_one':[10, 20], 'col_two':[30, 40]})
pd.DataFrame(np.random.rand(2, 3), columns=list('abc'))
pd.util.testing.makeMixedDataFrame()
See output 👇#Python#pandas#pandastrickspic.twitter.com/SSlZsd6OEj
🐼🤹♂️ pandas trick:
— Kevin Markham (@justmarkham) July 10, 2019
Need to create a DataFrame for testing?
pd.util.testing.makeDataFrame() ➡️ contains random values
.makeMissingDataframe() ➡️ some values missing
.makeTimeDataFrame() ➡️ has DateTimeIndex
.makeMixedDataFrame() ➡️ mixed data types#Python#pandas#pandastricks
Renaming columns
🐼🤹♂️ pandas trick:
— Kevin Markham (@justmarkham) July 16, 2019
3 ways to rename columns:
1. Most flexible option:
df = df.rename({'A':'a', 'B':'b'}, axis='columns')
2. Overwrite all column names:
df.columns = ['a', 'b']
3. Apply string method:
df.columns = df.columns.str.lower()#Python#DataScience#pandastricks
🐼🤹♂️ pandas trick:
— Kevin Markham (@justmarkham) June 11, 2019
Add a prefix to all of your column names:
df.add_prefix('X_')
Add a suffix to all of your column names:
df.add_suffix('_Y')#Python#DataScience
🐼🤹♂️ pandas trick:
— Kevin Markham (@justmarkham) June 25, 2019
Need to rename all of your columns in the same way? Use a string method:
Replace spaces with _:
df.columns = df.columns.str.replace(' ', '_')
Make lowercase & remove trailing whitespace:
df.columns = df.columns.str.lower().str.rstrip()#Python#pandastricks
Selecting rows and columns
🐼🤹♂️ pandas trick:
— Kevin Markham (@justmarkham) July 3, 2019
Need to select multiple rows/columns? "loc" is usually the solution:
select a slice (inclusive):
df.loc[0:4, 'col_A':'col_D']
select a list:
df.loc[[0, 3], ['col_A', 'col_C']]
select by condition:
df.loc[df.col_A=='val', 'col_D']#Python#pandastricks
🐼🤹♂️ pandas trick:
— Kevin Markham (@justmarkham) August 1, 2019
"loc" selects by label, and "iloc" selects by position.
But what if you need to select by label *and* position? You can still use loc or iloc!
See example 👇
P.S. Don't use "ix", it has been deprecated since 2017.#Python#DataScience#pandas#pandastrickspic.twitter.com/SpFkjWYEE0
🐼🤹♂️ pandas trick:
— Kevin Markham (@justmarkham) June 12, 2019
Reverse column order in a DataFrame:
df.loc[:, ::-1]
Reverse row order:
df.loc[::-1]
Reverse row order and reset the index:
df.loc[::-1].reset_index(drop=True)
Want more #pandastricks? Working on a video right now, stay tuned... 🎥#Python#DataScience
Filtering rows by condition
🐼🤹♂️ pandas trick:
— Kevin Markham (@justmarkham) June 13, 2019
Filter DataFrame by multiple OR conditions:
df[(df.color == 'red') | (df.color == 'green') | (df.color == 'blue')]
Shorter way:
df[df.color.isin(['red', 'green', 'blue'])]
Invert the filter:
df[~df.color.isin(['red', 'green', 'blue'])]#Python#pandastricks
🐼🤹♂️ pandas trick:
— Kevin Markham (@justmarkham) August 28, 2019
Are you trying to filter a DataFrame using lots of criteria? It can be hard to write ✏️ and to read! 🔍
Instead, save the criteria as objects and use them to filter. Or, use reduce() to combine the criteria!
See example 👇#Python#DataScience#pandastrickspic.twitter.com/U9NV27RIjQ
🐼🤹♂️ pandas trick:
— Kevin Markham (@justmarkham) July 25, 2019
Want to filter a DataFrame that doesn't have a name?
Use the query() method to avoid creating an intermediate variable!
See example 👇#Python#DataScience#pandas#pandastrickspic.twitter.com/NyUOOSr7Sc
🐼🤹♂️ pandas trick:
— Kevin Markham (@justmarkham) August 13, 2019
Need to refer to a local variable within a query() string? Just prefix it with the @ symbol!
See example 👇#Python#DataScience#pandas#pandastrickspic.twitter.com/PfXcASWDdC
🐼🤹♂️ pandas trick:
— Kevin Markham (@justmarkham) July 30, 2019
If you want to use query() on a column name containing a space, just surround it with backticks! (New in pandas 0.25)
See example 👇#Python#DataScience#pandas#pandastrickspic.twitter.com/M5ZSRVr3no
Manipulating strings
🐼🤹♂️ pandas trick:
— Kevin Markham (@justmarkham) August 22, 2019
Want to concatenate two string columns?
Option 1: Use a string method 🧶
Option 2: Use plus signs ➕
See example 👇
Which option do you prefer, and why?#Python#DataScience#pandas#pandastrickspic.twitter.com/SsjBAMqkxB
🐼🤹♂️ pandas trick:
— Kevin Markham (@justmarkham) July 9, 2019
Need to split a string into multiple columns? Use str.split() method, expand=True to return a DataFrame, and assign it to the original DataFrame.
See example 👇#Python#DataScience#pandas#pandastrickspic.twitter.com/wZ4okQZ9Dy
Working with data types
🐼🤹♂️ pandas trick:
— Kevin Markham (@justmarkham) June 17, 2019
Numbers stored as strings? Try astype():
df.astype({'col1':'int', 'col2':'float'})
But it will fail if you have any invalid input. Better way:
df.apply(https://t.co/H90jtE9QMp_numeric, errors='coerce')
Converts invalid input to NaN 🎉#Python#pandastricks
🐼🤹♂️ pandas trick:
— Kevin Markham (@justmarkham) June 14, 2019
Select columns by data type:https://t.co/8c3VWfaERD_dtypes(include='number')https://t.co/8c3VWfaERD_dtypes(include=['number', 'category', 'object'])https://t.co/8c3VWfaERD_dtypes(exclude=['datetime', 'timedelta'])#Python#DataScience#pandas#pandastricks
🐼🤹♂️ pandas trick:
— Kevin Markham (@justmarkham) August 8, 2019
Two useful properties of ordered categories:
1️⃣ You can sort the values in logical (not alphabetical) order
2️⃣ Comparison operators also work logically
See example 👇#Python#DataScience#pandas#pandastrickspic.twitter.com/HeYZ3P3gPP
Encoding data
🐼🤹♂️ pandas trick:
— Kevin Markham (@justmarkham) July 2, 2019
Need to convert a column from continuous to categorical? Use cut():
df['age_groups'] = pd.cut(df.age, bins=[0, 18, 65, 99], labels=['child', 'adult', 'elderly'])
0 to 18 ➡️ 'child'
18 to 65 ➡️ 'adult'
65 to 99 ➡️ 'elderly'#Python#pandas#pandastricks
🐼🤹♂️ pandas trick:
— Kevin Markham (@justmarkham) August 5, 2019
Want to dummy encode (or "one hot encode") your DataFrame? Use pd.get_dummies(df) to encode all object & category columns.
Want to drop the first level since it provides redundant info? Set drop_first=True.
See example & read thread 👇#Python#pandastrickspic.twitter.com/g0XjJ44eg2
🐼🤹♂️ pandas trick:
— Kevin Markham (@justmarkham) August 30, 2019
Need to apply the same mapping to multiple columns at once? Use "applymap" (DataFrame method) with "get" (dictionary method).
See example 👇#Python#DataScience#pandas#pandastrickspic.twitter.com/WU4AmeHP4O
Extracting data from lists
🐼🤹♂️ pandas trick:
— Kevin Markham (@justmarkham) June 27, 2019
Has your data ever been TRAPPED in a Series of Python lists? 🔒
Expand the Series into a DataFrame by using apply() and passing it the Series constructor 🔓
See example 👇#Python#DataScience#pandas#pandastrickspic.twitter.com/ZvysqaRz6S
🐼🤹♂️ pandas trick:
— Kevin Markham (@justmarkham) August 12, 2019
Do you have a Series containing lists of items? Create one row for each item using the "explode" method 💥
New in pandas 0.25! See example 👇
🤯#Python#DataScience#pandas#pandastrickspic.twitter.com/ix5d8CLg57
🐼🤹♂️ pandas trick:
— Kevin Markham (@justmarkham) August 14, 2019
Does your Series contain comma-separated items? Create one row for each item:
✂️ "str.split" creates a list of strings
⬅️ "assign" overwrites the existing column
💥 "explode" creates the rows (new in pandas 0.25)
See example 👇#Python#pandas#pandastrickspic.twitter.com/OqZNWdarP0
🐼🤹♂️ pandas trick:
— Kevin Markham (@justmarkham) August 16, 2019
💥 "explode" takes a list of items and creates one row for each item (new in pandas 0.25)
You can also do the reverse! See example 👇
Thanks to @EForEndeavour for this tip 🙌#Python#DataScience#pandas#pandastrickspic.twitter.com/4UBxbzHS51
Working with time series data
🐼🤹♂️ pandas trick:
— Kevin Markham (@justmarkham) July 8, 2019
If you need to create a single datetime column from multiple columns, you can use to_datetime() 📆
See example 👇
You must include: month, day, year
You can also include: hour, minute, second#Python#DataScience#pandas#pandastrickspic.twitter.com/0bip6SRDdF
🐼🤹♂️ pandas trick:
— Kevin Markham (@justmarkham) August 2, 2019
One reason to use the datetime data type is that you can access many useful attributes via "dt", like:
df.column.dt.hour
Other attributes include: year, month, day, dayofyear, week, weekday, quarter, days_in_month...
See full list 👇#Python#pandastrickspic.twitter.com/z405STKqKY
🐼🤹♂️ pandas trick:
— Kevin Markham (@justmarkham) July 18, 2019
Need to perform an aggregation (sum, mean, etc) with a given frequency (monthly, yearly, etc)?
Use resample! It's like a "groupby" for time series data. See example 👇
"Y" means yearly. See list of frequencies: https://t.co/oPDx85yqFT#Python#pandastrickspic.twitter.com/nweqbHXEtd
🐼🤹♂️ pandas trick:
— Kevin Markham (@justmarkham) August 27, 2019
Want to calculate the difference between each row and the previous row? Use df.col_name.diff()
Want to calculate the percentage change instead? Use df.col_name.pct_change()
See example 👇#Python#DataScience#pandas#pandastrickspic.twitter.com/5EGYqpNPC3
🐼🤹♂️ pandas trick:
— Kevin Markham (@justmarkham) July 31, 2019
Need to convert a datetime Series from UTC to another time zone?
1. Set current time zone ➡️ tz_localize('UTC')
2. Convert ➡️ tz_convert('America/Chicago')
Automatically handles Daylight Savings Time!
See example 👇#Python#DataScience#pandastrickspic.twitter.com/ztzMXcgkFY
Handling missing values
🐼🤹♂️ pandas trick:
— Kevin Markham (@justmarkham) June 19, 2019
Calculate % of missing values in each column:
df.isna().mean()
Drop columns with any missing values:
df.dropna(axis='columns')
Drop columns in which more than 10% of values are missing:
df.dropna(thresh=len(df)*0.9, axis='columns')#Python#pandastricks
🐼🤹♂️ pandas trick:
— Kevin Markham (@justmarkham) July 12, 2019
Need to fill missing values in your time series data? Use df.interpolate()
Defaults to linear interpolation, but many other methods are supported!
Want more pandas tricks? Watch this:
👉 https://t.co/6akbxXXHKg👈#Python#DataScience#pandas#pandastrickspic.twitter.com/JjH08dvjMK
🐼🤹♂️ pandas trick:
— Kevin Markham (@justmarkham) August 15, 2019
Do you need to store missing values ("NaN") in an integer Series? Use the "Int64" data type!
See example 👇
(New in v0.24, API is experimental/subject to change)#Python#DataScience#pandas#pandastrickspic.twitter.com/mN7Ud53Rls
Using aggregation functions
🐼🤹♂️ pandas trick:
— Kevin Markham (@justmarkham) July 19, 2019
Instead of aggregating by a single function (such as 'mean'), you can aggregate by multiple functions by using 'agg' (and passing it a list of functions) or by using 'describe' (for summary statistics 📊)
See example 👇#Python#DataScience#pandastrickspic.twitter.com/Emg3zLAocB
🐼🤹♂️ pandas trick:
— Kevin Markham (@justmarkham) August 9, 2019
Did you know that "last" is an aggregation function, just like "sum" and "mean"?
Can be used with a groupby to extract the last value in each group. See example 👇
P.S. You can also use "first" and "nth" functions!#Python#DataScience#pandas#pandastrickspic.twitter.com/WKJtNIUxwz
🐼🤹♂️ pandas trick:
— Kevin Markham (@justmarkham) August 21, 2019
Are you applying multiple aggregations after a groupby? Try "named aggregation":
✅ Allows you to name the output columns
❌ Avoids a column MultiIndex
New in pandas 0.25! See example 👇#Python#DataScience#pandas#pandastrickspic.twitter.com/VXJz6ShZbc
🐼🤹♂️ pandas trick:
— Kevin Markham (@justmarkham) September 4, 2019
Want to combine the output of an aggregation with the original DataFrame?
Instead of: df.groupby('col1').col2.func()
Use: df.groupby('col1').col2.transform(func)
"transform" changes the output shape
See example 👇#Python#DataScience#pandas#pandastrickspic.twitter.com/9dkcAGpTYK
Random sampling
🐼🤹♂️ pandas trick:
— Kevin Markham (@justmarkham) August 20, 2019
Randomly sample rows from a DataFrame:
df.sample(n=10)
df.sample(frac=0.25)
Useful parameters:
➡️ random_state: use any integer for reproducibility
➡️ replace: sample with replacement
➡️ weights: weight based on values in a column 😎#Python#pandastrickspic.twitter.com/j2AyoTLRKb
🐼🤹♂️ pandas trick:
— Kevin Markham (@justmarkham) August 26, 2019
Want to shuffle your DataFrame rows?
df.sample(frac=1, random_state=0)
Want to reset the index after shuffling?
df.sample(frac=1, random_state=0).reset_index(drop=True)#Python#DataScience#pandas#pandastricks
🐼🤹♂️ pandas trick:
— Kevin Markham (@justmarkham) June 18, 2019
Split a DataFrame into two random subsets:
df_1 = df.sample(frac=0.75, random_state=42)
df_2 = df.drop(df_1.index)
(Only works if df's index values are unique)
P.S. Working on a video of my 25 best #pandastricks, stay tuned! 📺#Python#pandas#DataScience
Merging DataFrames
🐼🤹♂️ pandas trick:
— Kevin Markham (@justmarkham) July 23, 2019
When you are merging DataFrames, you can identify the source of each row (left/right/both) by setting indicator=True.
See example 👇
P.S. Learn 25 more #pandastricks in 25 minutes: https://t.co/6akbxXG6SI#Python#DataScience#pandaspic.twitter.com/tkb2LiV4eh
🐼🤹♂️ pandas trick:
— Kevin Markham (@justmarkham) June 26, 2019
Merging datasets? Check that merge keys are unique in BOTH datasets:
pd.merge(left, right, validate='one_to_one')
✅ Use 'one_to_many' to only check uniqueness in LEFT
✅ Use 'many_to_one' to only check uniqueness in RIGHT#Python#DataScience#pandastricks
Styling DataFrames
🐼🤹♂️ pandas trick:
— Kevin Markham (@justmarkham) August 6, 2019
Two simple ways to style a DataFrame:
1️⃣ https://t.co/HRqLVf3cWC.hide_index()
2️⃣ https://t.co/HRqLVf3cWC.set_caption('My caption')
See example 👇
For more style options, watch trick #25: https://t.co/6akbxXG6SI📺#Python#DataScience#pandas#pandastrickspic.twitter.com/8yzyQYz9vr
🐼🤹♂️ pandas trick:
— Kevin Markham (@justmarkham) July 17, 2019
Want to add formatting to your DataFrame? For example:
- hide the index
- add a caption
- format numbers & dates
- highlight min & max values
Watch 👇 to learn how!
Code: https://t.co/HKroWYVIEs
25 more tricks: https://t.co/6akbxXG6SI#Python#pandastrickspic.twitter.com/AKQr7zVR7S
Exploring a dataset
🐼🤹♂️ pandas trick:
— Kevin Markham (@justmarkham) July 29, 2019
Want to explore a new dataset without too much work?
1. Pick one:
➡️ pip install pandas-profiling
➡️ conda install -c conda-forge pandas-profiling
2. import pandas_profiling
3. df.profile_report()
4. 🥳
See example 👇#Python#DataScience#pandastrickspic.twitter.com/srq5rptEUj
🐼🤹♂️ pandas trick:
— Kevin Markham (@justmarkham) June 24, 2019
Need to check if two Series contain the same elements?
❌ Don't do this:
df.A == df.B
✅ Do this:
df.A.equals(df.B)
✅ Also works for DataFrames:
df.equals(df2)
equals() properly handles NaNs, whereas == does not#Python#DataScience#pandas#pandastricks
🐼🤹♂️ pandas trick:
— Kevin Markham (@justmarkham) July 24, 2019
Want to examine the "head" of a wide DataFrame, but can't see all of the columns?
Solution #1: Change display options to show all columns
Solution #2: Transpose the head (swaps rows and columns)
See example 👇#Python#DataScience#pandas#pandastrickspic.twitter.com/9sw7O7cPeh
🐼🤹♂️ pandas trick:
— Kevin Markham (@justmarkham) August 23, 2019
Want to plot a DataFrame? It's as easy as:
df.plot(kind='...')
You can use:
line 📈
bar 📊
barh
hist
box 📦
kde
area
scatter
hexbin
pie 🥧
Other plot types are available via pd.plotting!
Examples: https://t.co/fXYtPeVpZX#Python#dataviz#pandastrickspic.twitter.com/kp82wA15S4
Other
🐼🤹♂️ pandas trick:
— Kevin Markham (@justmarkham) September 2, 2019
If you've created a groupby object, you can access any of the groups (as a DataFrame) using the get_group() method.
See example 👇#Python#DataScience#pandas#pandastrickspic.twitter.com/6Ya0kxMpgk
🐼🤹♂️ pandas trick:
— Kevin Markham (@justmarkham) July 1, 2019
Do you have a Series with a MultiIndex?
Reshape it into a DataFrame using the unstack() method. It's easier to read, plus you can interact with it using DataFrame methods!
See example 👇
P.S. Want a video with my top 25 #pandastricks? 📺#Python#pandaspic.twitter.com/DKHwN03A7J
🐼🤹 pandas trick:
— Kevin Markham (@justmarkham) July 26, 2019
There are many display options you can change:
max_rows
max_columns
max_colwidth
precision
date_dayfirst
date_yearfirst
How to use:
pd.set_option('display.max_rows', 80)
pd.reset_option('display.max_rows')
See all:
pd.describe_option()#Python#pandastricks
🐼🤹♂️ pandas trick:
— Kevin Markham (@justmarkham) July 5, 2019
Show total memory usage of a DataFrame:https://t.co/LkpMP7wWOi(memory_usage='deep')
Show memory used by each column:
df.memory_usage(deep=True)
Need to reduce? Drop unused columns, or convert object columns to 'category' type.#Python#pandas#pandastricks
🐼🤹♂️ pandas trick:
— Kevin Markham (@justmarkham) July 22, 2019
Want to use NumPy without importing it? You can access ALL of its functionality from within pandas! See example 👇
This is probably *not* a good idea since it breaks with a long-standing convention. But it's a neat trick 😎#Python#pandas#pandastrickspic.twitter.com/pZbXwuj6Kz
↧
Test and Code: 86: Teaching testing best practices with 4 testing maxims - Josh Peak
You've incorporated software testing into your coding practices and know from experience that it helps you get your stuff done faster with less headache.
Awesome.
Now your colleagues want in on that super power and want to learn testing.
How do you help them?
That's where Josh Peak is. He's helping his team add testing to their workflow to boost their productivity.
That's what we're talking about today on Test & Code.
Josh walks us through 4 maxims of developing software tests that help grow your confidence and proficiency at test writing.
Special Guest: Josh Peak.
Sponsored By:
- Raygun: Detect, diagnose, and destroy Python errors that are affecting your customers. With smart Python error monitoring software from Raygun, you can be alerted to issues affecting your users the second they happen.
Support Test & Code - Python Testing & Development
Links:
<p>You've incorporated software testing into your coding practices and know from experience that it helps you get your stuff done faster with less headache.</p> <p>Awesome.</p> <p>Now your colleagues want in on that super power and want to learn testing.</p> <p>How do you help them? </p> <p>That's where Josh Peak is. He's helping his team add testing to their workflow to boost their productivity. </p> <p>That's what we're talking about today on Test & Code.</p> <p>Josh walks us through 4 maxims of developing software tests that help grow your confidence and proficiency at test writing.</p><p>Special Guest: Josh Peak.</p><p>Sponsored By:</p><ul><li><a href="https://raygun.com" rel="nofollow">Raygun</a>: <a href="https://raygun.com" rel="nofollow">Detect, diagnose, and destroy Python errors that are affecting your customers. With smart Python error monitoring software from Raygun, you can be alerted to issues affecting your users the second they happen.</a></li></ul><p><a href="https://www.patreon.com/testpodcast" rel="payment">Support Test & Code - Python Testing & Development</a></p><p>Links:</p><ul><li><a href="https://joshpeak.net/posts/2019-07-22-from-zero-to-test.html" title="From Zero to Test: Turning hurdles into steps. " rel="nofollow">From Zero to Test: Turning hurdles into steps. </a></li><li><a href="https://joshpeak.net/posts/2019-06-18-Advanced-python-testing.html" title="Advanced Python Testing" rel="nofollow">Advanced Python Testing</a> — Posts</li><li><a href="https://pypi.org/project/pytest-vcr/" title="pytest-vcr" rel="nofollow">pytest-vcr</a></li><li><a href="https://vcrpy.readthedocs.io/en/latest/" title="VCR.py" rel="nofollow">VCR.py</a></li><li><a href="https://pypi.org/project/pytest-randomly/" title="pytest-randomly" rel="nofollow">pytest-randomly</a></li></ul>↧
↧
TechBeamers Python: Multiline String in Python with Examples
This tutorial explains how to create a Python multiline string. It can be handy when you have a very long string. You shouldn’t keep such text in a single line. It kills the readability of your code. In Python, you have different ways to specify a multiline string. You can have a string split across multiple lines by enclosing it in triple quotes. Alternatively, brackets can also be used to spread a string into different lines. Moreover, backslash works as a line continuation character in Python. You can use it to join text on separate lines and create a multiline
The post Multiline String in Python with Examples appeared first on Learn Programming and Software Testing.
↧
Wingware News: Wing Python IDE 7.1.1 - September 6, 2019
Wing 7.1.1 avoids slowing and dropping of remote development connections, fixes showing Pandas DataFrame and Series values, makes OS Commands work on remote hosts with Python 3, inspects remote extension modules with non-ascii characters in the interface, adds __init__ arguments to the auto-completer, allows ignoring exceptions in frozen importlib files, fixes line numbers shown in pytest exception tracebacks, and fixes other minor usability issues.

Download Wing 7.1.1 Now:Wing Pro | Wing Personal | Wing 101 | Compare Products
![]() Some Highlights of Wing 7.1
Some Highlights of Wing 7.1
 Some Highlights of Wing 7.1
Support for Python 3.8
Wing 7.1 supports editing, testing, and debugging code written for Python 3.8, so you can take advantage of assignment expressions and other improvements introduced in this new version of Python.
Improved Code Warnings
Wing 7.1 adds unused symbol warnings for imports, variables, and arguments found in Python code. This release also improves code warnings configuration, making it easier to disable unwanted warnings.
Cosmetic Improvements
Wing 7.1 improves the auto-completer, project tool, and code browser with redesigned icons that make use of Wing's icon color configuration. This release also improves text display on some Linux systems, supports Dark Mode on macOS, and improves display of Python code and icons found in documentation.
And More
Wing 7.1 also adds support for Windows 10 native OpenSSH installations for remote development, and makes a number of other minor improvements. This release drops support for macOS 10.11. System requirements remain unchanged on Windows and Linux.
For details see the change log.
For a complete list of new features in Wing 7, see What's New in Wing 7.
![]() Try Wing 7.1 Now!
Try Wing 7.1 Now!
Wing 7.1 is an exciting new step for Wingware's Python IDE product line. Find out how Wing 7.1 can turbocharge your Python development by trying it today.
Downloads:Wing Pro | Wing Personal | Wing 101 | Compare Products
See Upgrading for details on upgrading from Wing 6 and earlier, and Migrating from Older Versions for a list of compatibility notes.
↧
Doug Hellmann: imapautofiler 1.8.1
imapautofiler applies user-defined rules to automatically organize messages on an IMAP server. What’s new in 1.8.1? Fix comparison with TZ aware datetime in TimeLimit rule (contributed by Nicolas Le Manchet)![]()
![]()
![]()
![]()
↧
Weekly Python StackOverflow Report: (cxciii) stackoverflow python report
These are the ten most rated questions at Stack Overflow last week.
Between brackets: [question score / answers count]
Build date: 2019-09-07 19:23:05 GMT
- Variable scope and name resolution in Python - [17/4]
- Pandas transform inconsistent behavior for list - [15/3]
- Weird file seeking behaviour - [11/1]
- python: how to differentiate between cases of ValueError? - [8/2]
- 'continue' the 'for' loop to the previous element - [7/4]
- How can I split a dictionary in several dictionaries based on a part of values using Python - [6/5]
- Fill in same amount of characters where other column is NaN - [6/4]
- Why is there a huge difference in performance though time complexity for the two functions below seems to be similar? - [6/3]
- How to perform a cumulative sum of distinct values in pandas dataframe - [6/3]
- Count strings in nested list - [6/3]
↧
↧
ListenData: A Complete Guide to Linear Regression in Python
In this article we covered linear regression using Python in detail. It includes its meaning along with assumptions related to the linear regression technique. After completing this tutorial you will be able to test these assumptions as well as model development and validation in Python.
In the following diagram we can see that as horsepower increases mileage decreases thus we can think to fit linear regression. The red line is the fitted line of regression and the points denote the actual observations.
![]()
The vertical distance between the points and the fitted line (line of best fit) are called errors. The main idea is to fit this line of regression by minimizing the sum of squares of these errors. This is also known as principle of least squares.
READ MORE »
Table of Contents
 |
| Python : Linear Regression |
Introduction to Linear Regression
Linear Regression is a supervised statistical technique where we try to estimate the dependent variable with a given set of independent variables. We assume the relationship to be linear and our dependent variable must be continuous in nature.In the following diagram we can see that as horsepower increases mileage decreases thus we can think to fit linear regression. The red line is the fitted line of regression and the points denote the actual observations.
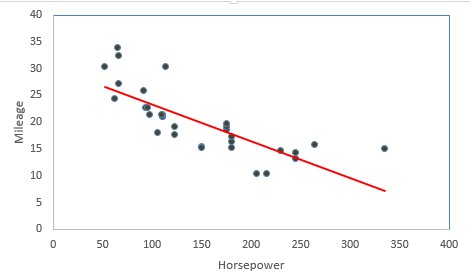
The vertical distance between the points and the fitted line (line of best fit) are called errors. The main idea is to fit this line of regression by minimizing the sum of squares of these errors. This is also known as principle of least squares.
Examples of Linear Regression
- Estimating the price (Y) of a house on the basis of its Area (X1), Number of bedrooms (X2), proximity to market (X3) etc.
- Estimating the mileage of a car (Y) on the basis of its displacement (X1), horsepower(X2), number of cylinders(X3), whether it is automatic or manual (X4) etc.
- To find the treatment cost or to predict the treatment cost on the basis of factors like age, weight, past medical history, or even if there are blood reports, we can use the information from the blood report.
↧
Codementor: In Python How Recursion Works on Run Time
Photo by Martin Adams (https://unsplash.com/@martinadams?utmsource=unsplash&utmmedium=referral&utm_content=creditCopyText) on Unsplash...
↧
Python Bytes: #146 Slay the dragon, learn the Python
↧
Erik Marsja: How to Read & Write SPSS Files in Python using Pandas
The post How to Read & Write SPSS Files in Python using Pandas appeared first on Erik Marsja.
In this post we are going to learn 1) how to read SPSS (.sav) files in Python, and 2) how to write to SPSS (.sav) files using Python.
Python is a great general-purpose language as well as for carrying out statistical analysis and data visualization. However, Python is not really user-friendly for data storage. Thus, often our data will be archived using Excel, SPSS or similar software.
How to open a .sav file in Python? There are some packages as Pyreadstat, and Pandas which allow to perform this operation. If we are working with Pandas, the read_spss method will load a .sav file into a Pandas dataframe. Note, Pyreadstat will also create a Pandas dataframe from a SPSS file.
How to Open a SPSS file in Python
Here’s two simple steps on how to read .sav files in Python using Pandas (more details will be provided in this post):
- import pandas
in your script type “import pandas as pd“
- use read_spss
in your script use the read_spss method:
df = read_spss(‘PATH_TO_SAV_FILE”)
In this secion, we are going to learn how to load a SPSS file in Python using the Python package Pyreadstat. Before we use Pyreadstat we are going to install it. This Python package can be installed in two ways.
How to install Pyreadstat:
There are two very easy methods to install Pyreadstat.:
- Install Pyreadstat using pip:
Open up a terminal, or windows command prompt, and type pip install pyreadstat - Install using Conda:
Open up a terminal, or windows command prompt, and type conda install -c conda-forge pyreadstat
How to Load a .sav File in Python Using Pyreadstat
Every time we run our Jupyter notebook, we need to load the packages we need. In the, Python read SPSS example below we will use Pyreadstat and, thus, the first line of code will import the package:
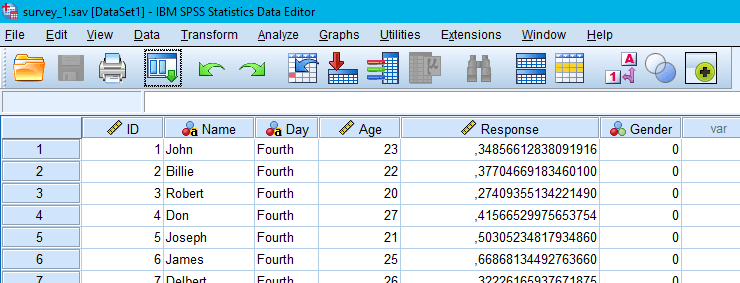
import pyreadstatNow, we can use the method read_sav to read a SPSS file. Note that, when we load a file using the Pyreadstat package, recognize that it will look for the file in Python’s working directory. In the read SPSS file in Python example below, we are going to use this SPSS file. Make sure to download it and put it in the correct folder (or change the path in the code chunk below):
df, meta = pyreadstat.read_sav('./SimData/survey_1.sav')In the code chunk above we create two variables; df, and meta. As can be seen when using type df is a Pandas dataframe:
type(df)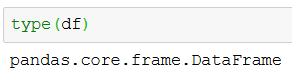
Thus, we can use all methods available for Pandas dataframe objects. In the next line of code, we are going to print the 5 first rows of the dataframe using pandas head method.
df.head()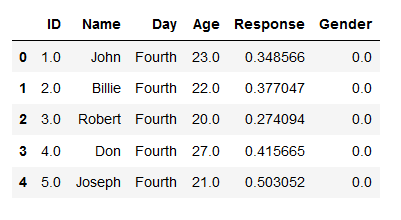
See more about working with Pandas dataframes in the following tutorials:
- Python Groupby Tutorial: Here you will learn about working the the groupby method to group Pandas dataframes.
- Learn how to take random samples from a pandas dataframe
- A more general, overview, of how to work with Pandas dataframe objects can be found in the Pandas Dataframe tutorial.
How to Read a SPSS file in Python Using Pandas
Pandas can, of course, also be used to load a SPSS file into a dataframe. Note, however, we need to install the Pyreadstat package as, at least right now, Pandas depends on this for reading .sav files. As always, we need to import Pandas as pd:
import pandas as pdNow, when we have done that, we can read the .sav file into a Pandas dataframe using the read_spss method. In the read SPSS example below, we read the same data file as earlier and print the 5 last rows of the dataframe using Pandas tail method. Remember, using this method also requires you to have the file in the subfolder “simData” (or change the path in the script).
df = pd.read_spss('./SimData/survey_1.sav')
df.tail()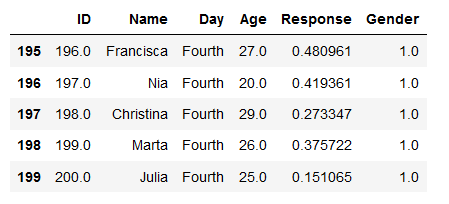
Note, that both read_sav (Pyreadstat) and read_spss have the arguments “usecols”. By using this argument, we can also select which columns we want to load from the SPSS file to the dataframe:
cols = ['ID', 'Day', 'Age', 'Response', 'Gender']
df = pd.read_spss('./SimData/survey_1.sav', usecols=cols)
df.head()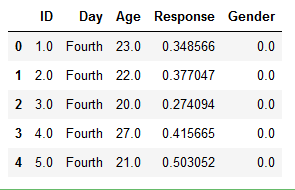
How to Write a SPSS file Using Python
Now we are going to learn how to save Pandas dataframe to a SPSS file. It’s simpe, we will use the Pyreadstats write_sav method. The first argument should be the Pandas dataframe that is going to be saved as a .sav file.
pyreadstat.write_sav(df, './SimData/survey_1_copy.sav')Remember to put the right path, as second argument, when using write_sav to save a .sav file.
Unfortunately, Pandas don’t have a to_spss method, yet. But, as Pyreadstats is a dependency of Pandas read_spss method we can use it to write a SPSS file in Python.
Summary: Read and Write .sav Files in Python
Now we have learned how to read and write .sav files using Python. It was quite simple and both methods are, in fact, using the same Python packages.
Here’s a Jupyter notebook with the code used in this Python SPSS tutorial.
The post How to Read & Write SPSS Files in Python using Pandas appeared first on Erik Marsja.
↧
↧
Mike Driscoll: PyDev of the Week: Aymeric Augustin
This week we welcome Aymeric Augustin (@aymericaugustin) as our PyDev of the Week. Aymeric is a core developer of Django, a Python web framework. He is also an entrepreneur and speaker at several Django related conferences. You can catch up with Aymeric over on his website or check out his FOSS contributions on Github. Let’s take a few moments to get to know him better!

Can you tell us a little about yourself (hobbies, education, etc):
Do you know how to spot a Frenchman? That’s always the first thing they mention! Now that’s out of the way…
These days my hobbies center around being the dad of three wonderful girls  We’re doing a lot of physical activity together: swimming, cycling, gardening, playing music, etc.
I’m managing a software engineering department of about 200 people at CANAL+, a French audiovisual media group that operates TV services in several countries.
I was trained as a generalist engineer, eventually specializing in Computer Science and Information Technology, but I learnt most of what I do on the job.
Why did you start using Python?
In 2006, a friend told me about this great, simple language called Python. At first I dismissed it: I said that PHP was simple enough for anything I wanted to do. This ranks quite high on the long list of stupid things I said
One year later, I was doing an internship at (now defunct) Zonbu, living the startup life in Palo Alto. That’s when I wrote my first Python application. It was a desktop GUI for encoding videos such that they’d play on iPods or on the just-released iPhone. I built it with PyGTK and glade. Under the hood, it ran mencoder and MP4box.
I dug out the source code from my archives for this interview. Not only did it use tabs for indentation and backslashes for line breaks, but it also sported an elegant logging system:
if __debug__:
    print("INFO: Initializing BackgroundEncoder")
Then, in 2009, in my first job, I wrote two non-trivial Python projects. I was working on an in-train entertainment portal. The first one centralized onboard communications between the web portal and the network infrastructure. The second one managed content synchronization depending on available network connectivity. I had discovered the concept of automated tests and I was very proud of my test coverage.
What other programming languages do you know and which is your favorite?
My first language was Basic, first FutureBASIC in 1995 and later TI-BASIC. Then a friend introduced me to HTML and the World Wide Web in 1997. Together, we made a website for our high school.
My Computer Science courses were mostly in Caml — a great language for the mathematically oriented but little known outside French academia, Java, and C. I also had the opportunity to try other interesting languages such as Erlang, Factor, Haskell, and Scheme.
I still enjoy writing small bits of C, mostly for Python extensions. I haven’t used Java since 1.5 was the latest and greatest. I can’t claim I still know it. I tried C# .NET around the same time. I didn’t like it because the documentation always told me what I knew already and never what I wanted to know.
Outside courses, I wrote a lot of PHP. If you’re reading this, you’re probably aware of the challenges of writing significant projects in PHP. However, I wouldn’t be here without PHP, so I’m grateful that it exists. Step by step, I went from static HTML to small dynamic bits, then to factoring out repeated sections, then to writing my own mini-framework, then to Python and Django. That was a good learning path.
Professionally, besides Python, I’ve been writing JavaScript and CSS. I taught myself modern full-stack development when I co-founded Otherwise— because being the CTO at a start-up means you’re the only developer at first. Earlier in my career, I also wrote some Ruby, but I was more comfortable with Django than with Rails.
Purely from a language perspective, I still like Caml a lot. I’m certainly romanticizing memories of when I learnt programming Anyway, sometimes I feel like I’m a static typing fan lost in Python land!
What projects are you working on now?
I’m mostly maintaining websockets these days. That’s a good challenge in two areas where I still have a lot to learn: concurrent programming and good documentation.
Currently I’m thinking about decoupling the protocol from the I/O. I’d like to build alternatives based on trio and curio. However, this would be a large refactor of the current implementation based on asyncio. Its benefits are mostly theoretical. I’m still wondering if I really want to spend time there.
I started websockets when Guido van Rossum was building asyncio, which was called tulip then. I had a use case at work for which the WebSocket protocol seemed like a good match. Inspired by the marketing of requests, I decided to build an open source library that would become a success thanks to a great API. I missed that marketing was at least as important as API design Still, websockets became modestly popular. I left that job a few months later. I never used websockets for anything in practice. It’s a hobby for me, which gives me a lot of freedom to experiment.
I’m struggling with an unintended consequence, though. Judging by GitHub issues, the main use case for websockets seems to be connecting to cryptocurrency trackers. I wish I wasn’t contributing, even indirectly, to this environmental disaster. (Bitcoin miners burn far too much coal and add far too much carbon dioxide to the atmosphere. I know about theoretical alternatives but I’m more interested in reality as it stands. Bitcoin consumes as much electricity as Austria and has no mainstream use case besides speculation and buying illegal goods.)
I understand why the open source ethos rejects restrictions on how software is used. Still, it’s frustrating to give my time and energy freely to people who act directly against my beliefs.
Which Python libraries are your favorite (core or 3rd party)?
I have only good things to say about whitenoise. It’s liberating to serve static files efficiently with a WSGI server and let a CDN do the rest.
I like challengers that fare better than the mainstream solution on one aspect I care about. I prefer waitress over gunicorn because it’s less vulnerable to slowloris attacks, so it doesn’t require setting up nginx. I use django-s3-storage rather than django-storages because its implementation of listdir() has decent performance. I recently started looking at trio as an alternative to asyncio and I like the design in theory. Hopefully I’ll also like it in practice.
I can’t pass this opportunity to plug one of my libraries Check out datedelta. You’ll like it!
How did you become a core developer of Django?
I discovered Django in 2008 thanks to Jeremy Lainé. In January 2010, he asked for my opinion on a bug he was hitting and we filed a ticket. Jeremy was an experienced open source contributor already — he was a Debian Developer. He made me realize I could contribute to open source software!
On the day of my 25th birthday, I tried to contribute for the first time. A few days later, I managed to get my first patch committed — a JavaScript patch I have no idea why I did that; I didn’t go any further. (As a side note, it’s pretty cool to have all that history preserved in public tools.)
In January 2011, when I started building the software for Autolib’, a car sharing service in Paris, I had the opportunity to choose the stack. I decided to go with Django and PostgreSQL. For the next three years, I’d work full time with Django, pushing it to its limits and beyond.
In March 2011, Stéphanie and I got married and I started contributing much more actively — hopefully a coincidence? At that time, it was hard to get a review for a patch. Django didn’t have fellows. I was frustrated by the low success rate of submitting patches.
In April 2011, Jacob Kaplan-Moss, BDFL of Django, made a 5-for-1 offer: triage five tickets and a core dev will review one. Exactly what I needed! I jumped on the opportunity and used it five times. I got the hang of triaging tickets and ended up handling 70 tickets in three weeks.
Around that time, I challenged myself to become a Django core developer. I think I was looking for the ego boost associated with the perceived prestige of that position, perhaps also for the ability to commit my own patches when no one cared. (In hindsight, I wish I’d had less selfish reasons, but that’s how it went. 2011 was a difficult year.)
So, I followed the manual. It said that would-be committers should contribute a major feature. Good. I went through the list of Google Summer of Code ideas. I looked for a feature that I could complete with minimal risks. I picked “Multiple timezone support for datetime representation”.
As a bonus, it would be useful for Autolib’. If a customer rented a car during the DST change, we couldn’t calculate the right duration and the right price. This wasn’t possible with Django 1.3 because it didn’t support timezone-aware datetimes.
I researched the issue thoroughly. In September, I sent a proposal on django-developers. That did the trick even before I wrote the code! Two weeks later, Carl Meyer proposed to add me to the core team. That’s how I became a core developer.
Finally, when the time zone support patch was ready, Luke Plant was kind enough to review it and I was thrilled to commit it by myself!
As you can see, I wouldn’t be there without a lot of luck, good advice from colleagues, help from fellow contributors, and the support of Stéphanie.
What excites you about Django?
Django grew quickly from a framework to an ecosystem to a community. Jacob Kaplan-Moss shaped the project that way. Many community members put an incredible amount of work to turn that opportunity into a massive success.
Do you know many technical communities where volunteers…
- mentored 20k women by holding workshops in 500 cities in 100 countries?
- fostered a local community until it was ready to organize a conference in Africa?
- award a prize to those who welcome newcomers, freely give assistance, and help to grow the community?
And I haven’t even mentioned excellent conferences such as DjangoCon Europe and Django under the Hood.
From a technical perspective, Django is exciting because it’s boring. Who wants to spend time thinking about their framework rather than their app? Django and its ecosystem cover the needs of many web apps, large and small. It’s robust, well documented, well tested, and unfashionable. What else?
Is there anything else you’d like to say?
I find it most interesting to look at open source from an ecological perspective. There’ve been massive changes in the ecosystem over the past decade. We’re still at the beginning.
When looking at individual projects, often the picture is bleak. Most projects rely on a few key contributors who struggle with burnout. We haven’t figured out sustainability yet.
When looking at the broader picture, there’s more energy than ever. New projects get started all the time. Best practices are getting mature.
Django isn’t the hot new thing it was in 2008, but the DSF pays full-time fellows to ensure that it’s maintained well. Since 2014, I’ve been thinking the next frontier for Django was to make inroads in enterprise IT. I don’t know if that’s really going to happen, but it seems possible!
Today, volunteer time is the currency of open source. Tomorrow, money will play a bigger part. We don’t know how that will work yet. Corporate interactions with open source are often disappointing, but they’re improving as IT stakeholders get a better understanding of open source.
Open source will thrive if we keep the learning paths wide open and if we figure out how to organize larger efforts. It’s fine if millions of aspiring programmers write their own mini-frameworks: they’re building the skills to contribute to larger projects. We’ve seen a lot of progress in social norms in open source communities and in their codification. I hope we’ll develop governance practices that make it easier to scale large, community-driven open source projects!
Thanks for doing the interview, Aymeric
The post PyDev of the Week: Aymeric Augustin appeared first on The Mouse Vs. The Python.
↧
Codementor: Conditional Execution in Python
A developer can set a conditional execution structure to develop into python code to manage a few kinds of Boolean and arithmetic operations.
↧
EuroPython Society: EuroPython 2020: RFP for Venues
We are happy to announce that we have started the RFP for venues to host the EuroPython 2020 conference.

We have sent out the details to more than 40 venues.
Like last year, we also want to give the chance to other venues who were not on our list to participate in the RFP. For this purpose, we are making the details available in this blog post as well.
RFP Introduction
The EuroPython Society is the organization behind the EuroPython conference, the largest Python programming language conference in Europe, with more than 1100 professionals from IT, science and educational fields attending to learn about new developments, network and learn from experience of others in the field.
Python is a very popular open source programming language, with a large following in the web development and data science fields.
EuroPython was initiated in 2002, with the first conference in Charleroi, Belgium, and has since toured Europe for a total of 18 editions so far. For EuroPython 2020 we are looking for a new location and venue and are reaching out to potential venues.
If you’d like to participate in this process, please have a look at the RFP spreadsheet in form of an Excel spreadsheet with a quote section and list of questions, as well as our EuroPython 2019 sponsor brochure with more details about the conference, the demographics and our offerings for sponsors, to give you an idea of what we are looking for.
Please see the first tab in the spreadsheet for a description of the submission process. If you have questions, please write to board@europython.eu.
You can also check these other resources:
- EuroPython 2019 website: https://ep2019.europython.eu/en/
- EuroPython videos: http://europython.tv/
- EuroPython pictures: https://www.flickr.com/groups/europython2019/
- EuroPython blog: http://blog.europython.eu/
- EuroPython Twitter channel: https://twitter.com/europython
- EuroPython Society: http://www.europython-society.org/
Timeline
This is the timeline for the RFP:
First round:
- Start of RFP process: 2019-09-09
- Deadline for RFP vendor questions: 2019-09-16
- Vendor questions answered by: 2019-09-20
- First round submission deadline: 2019-09-27
- Second round candidates will be informed until: 2019-10-07
Second round:
- Second round RFP questions posted: 2019-10-13
- Deadline for RFP vendor questions: 2019-10-16
- Vendor questions answered by: 2019-10-20
- Final submission deadline: 2019-10-25
- Final candidate will be informed until: 2019-10-30
RFP Resources
- EuroPython 2019 sponsor brochure
- First round RFP spreadsheet
- RFP submission form for uploading the filled in spreadsheet and any additional documents, you may want to provide
Many thanks,
–
EuroPython Society Board
https://www.europython-society.org/
↧
Catalin George Festila: Python 3.7.3 : Using the flask - part 018.
In this tutorial, I will show you how to fix auto increment in Flask SQLAlchemy.
The old source code for the user model from the server.py was this:
class User(db.Model):
id = db.Column(db.Integer, primary_key=True)
username = db.Column(db.String(80), unique=True)
password = db.Column(db.String(120), unique=True)
email = db.Column(db.String(120), unique=True)
gender =
↧
↧
EuroPython: EuroPython 2020: RFP for Venues
We are happy to announce that we have started the RFP for venues to host the EuroPython 2020 conference.
We have sent out the details to more than 40 venues.
Like last year, we also want to give the chance to other venues who were not on our list to participate in the RFP. For this purpose, we are making the details available in this blog post as well.
RFP Introduction
The EuroPython Society is the organization behind the EuroPython conference, the largest Python programming language conference in Europe, with more than 1100 professionals from IT, science and educational fields attending to learn about new developments, network and learn from experience of others in the field.
Python is a very popular open source programming language, with a large following in the web development and data science fields.
EuroPython was initiated in 2002, with the first conference in Charleroi, Belgium, and has since toured Europe for a total of 18 editions so far. For EuroPython 2020 we are looking for a new location and venue and are reaching out to potential venues.
If you’d like to participate in this process, please have a look at the RFP spreadsheet in form of an Excel spreadsheet with a quote section and list of questions, as well as our EuroPython 2019 sponsor brochure with more details about the conference, the demographics and our offerings for sponsors, to give you an idea of what we are looking for.
Please see the first tab in the spreadsheet for a description of the submission process. If you have questions, please write to board@europython.eu.
You can also check these other resources:
- EuroPython 2019 website: https://ep2019.europython.eu/en/
- EuroPython videos: http://europython.tv/
- EuroPython pictures: https://www.flickr.com/groups/europython2019/
- EuroPython blog: http://blog.europython.eu/
- EuroPython Twitter channel: https://twitter.com/europython
- EuroPython Society: http://www.europython-society.org/
Timeline
This is the timeline for the RFP:
First round:
- Start of RFP process: 2019-09-09
- Deadline for RFP vendor questions: 2019-09-16
- Vendor questions answered by: 2019-09-20
- First round submission deadline: 2019-09-27
- Second round candidates will be informed until: 2019-10-07
Second round:
- Second round RFP questions posted: 2019-10-13
- Deadline for RFP vendor questions: 2019-10-16
- Vendor questions answered by: 2019-10-20
- Final submission deadline: 2019-10-25
- Final candidate will be informed until: 2019-10-30
RFP Resources
- EuroPython 2019 sponsor brochure
- First round RFP spreadsheet
- RFP submission form for uploading the filled in spreadsheet and any additional documents, you may want to provide
Many thanks,
–
EuroPython Society Board
https://www.europython-society.org/
↧
Reuven Lerner: Learn and understand Python objects — with Weekly Python Exercise, starting September 17
I’ve found that many Python developers are confused by object-oriented programming in the language:
- Newcomers to programming are confused by object-oriented ideas and terminology, while
- Veteran programmers are surprised and confused by how Python objects work
No matter which camp you’re in, I have good news for you: Weekly Python Exercise will be starting a new cohort on September 17th, and it’s all about object-oriented programming in Python. Join me as we learn by doing, solving problems with objects, instances, classes, attributes, class attributes, and inheritance.
By the end of the course, you’ll understand how objects work, and will know how to use them in your own projects.
Join me and other Python developers from around the world in this upcoming cohort. To sign up, see samples, or learn more, just go to https://WeeklyPythonExercise.com/ . See you on the 17th!
The post Learn and understand Python objects — with Weekly Python Exercise, starting September 17 appeared first on Reuven Lerner.
↧
Python Insider: Python 3.5.8rc1 is now available
↧