Learn And Code Confusion Matrix With Python
The confusion matrix is a way to visualize how many samples from each label got predicted correctly. The beauty of the confusion matrix is that it actually allows us to see where the model fails and where the model succeeds, especially when the labels are imbalanced. In other words, we are able to see beyond the model's accuracy.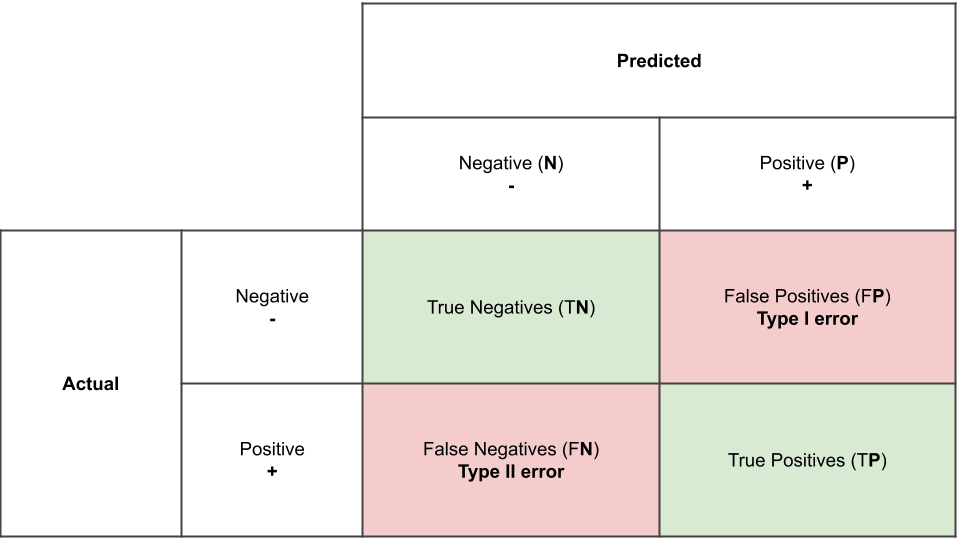
P.S. some people use predicted values on the rows, and actual values on the columns, which is just the transpose of this matrix. Some people start by the negative class first then the positive class. These are just different ways of drawing the confusion matrix, and all convey the same thing.

Confusion Matrix in Python
Let's try generating a confusion matrix in python
importrandomimportnumpyasnp# first 50 values are positive-labels (1), second 50 values are negative-labels (0)actual_values=[1]*50+[0]*50predicted_values=random.choices([0,1],k=100)# randomly generate 0 and 1 labelspredicted_values[0:5]We can calculate then each of the 4 possible outcomes in the confusion matrix by simply comparing each value in the actual_values to its corresponding value in the predicted_values
fp=0fn=0tp=0tn=0foractual_value,predicted_valueinzip(actual_values,predicted_values):# let's first see if it's a true (t) or false prediction (f)ifpredicted_value==actual_value:# t?ifpredicted_value==1:# tptp+=1else:# tntn+=1else:# f?ifpredicted_value==1:# fpfp+=1else:# fnfn+=1our_confusion_matrix=[[tn,fp],[fn,tp]]# we convert it to numpy array to be printed properly as a matrixour_confusion_matrix=np.array(our_confusion_matrix)our_confusion_matrixWe can get the same confusion matrix using sklearn.metrics.confusion_matrix function
fromsklearn.metricsimportconfusion_matrixconfusion_matrix(actual_values,predicted_values)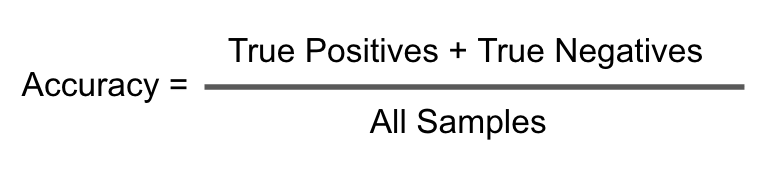
accuracy=(tp+tn)/100accuracy# orfromsklearn.metricsimportaccuracy_scoreaccuracy_score(actual_values,predicted_values)Precision vs Recall
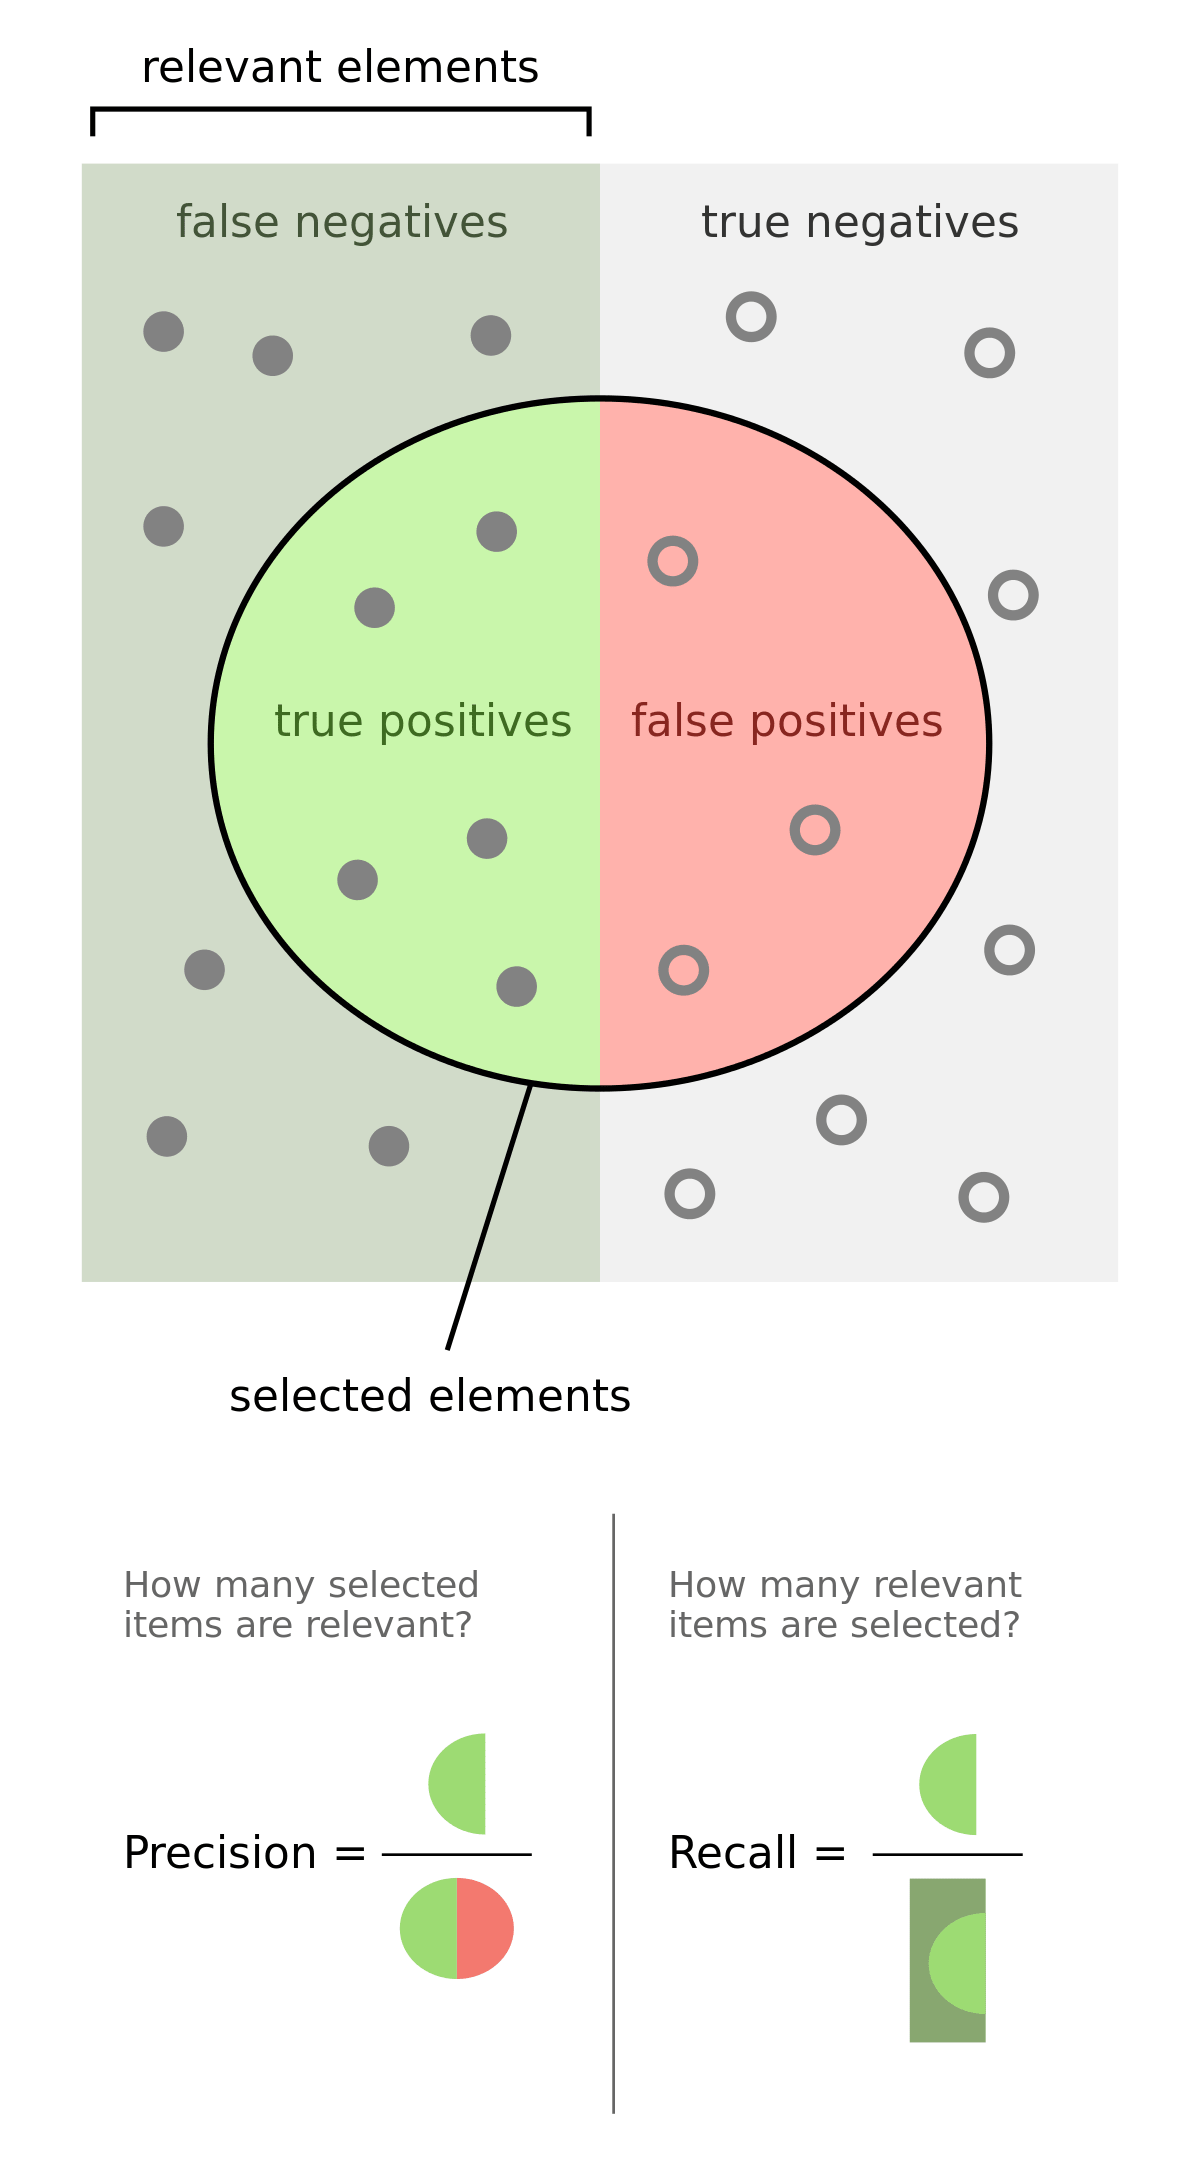
Precision
Precision calculates percentage of how many times a prediction is correct out of total predictions made. Example - If you predicted that 100 patients would catch Covid-19, but only 90 of patients actually got covid, then your precision is 90%. So out of all predicted positives (true positive and false positive) how many are actually true positive(tp)?
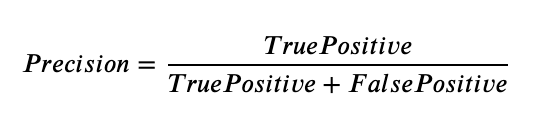
all_predicted_positives=tp+fpprecision_positive=tp/all_predicted_positivesprecision_positive# orfromsklearn.metricsimportprecision_scoreprecision_score(actual_values,predicted_values,pos_label=1)# precision_positive# for the negative classall_predicted_negatives=tn+fnprecision_negative=tn/all_predicted_negativesprecision_negative# here we trick sklearn to think that positive label is 0 not 1 :)precision_score(actual_values,predicted_values,pos_label=0)# precision_negative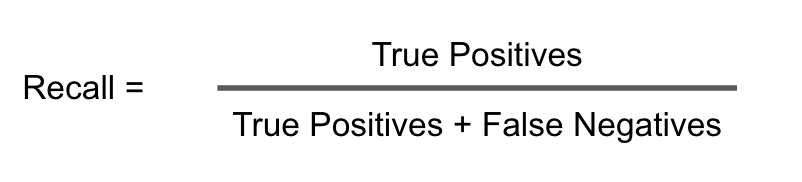
all_actual_positive=tp+fnrecall_positive=tp/all_actual_positiverecall_positive# orfromsklearn.metricsimportrecall_scorerecall_score(actual_values,predicted_values)# recall_positiveall_actual_negative=tn+fprecall_negative=tn/all_actual_negativerecall_negative# here we trick sklearn to think that positive label is 0 not 1 :)recall_score(actual_values,predicted_values,pos_label=0)# recall_negativeImportance of Precision and Recall
Let's say your dataset has just 10 positive samples, and 90 negative samples. If you use a classifier that classifies everything as negative, its accuracy would be 90%, which is misleadingly. But the classifier is actually pretty dumb! So let's calculate the precision and recall for such a model
# dataactual_values=[0]*90+[1]*10predicted_values=[0]*100acc=accuracy_score(actual_values,predicted_values)prec_pos=precision_score(actual_values,predicted_values)recall_pos=recall_score(actual_values,predicted_values)prec_neg=precision_score(actual_values,predicted_values,pos_label=0)recall_neg=recall_score(actual_values,predicted_values,pos_label=0)print(f"Accuracy: {acc}")print(f"Precision (+): {prec_pos}")print(f"Recall (+): {recall_pos}")print(f"Precision (-): {prec_neg}")print(f"Recall (-): {recall_neg}")Sklearn is warning us about a zero division? where is that. It is in the precision of the positive class. We should be dividing by all the predicited positives, but the model made no positive predictions, so that is a zero! More importantly, the positive recall is also zero, because the model did not detect any of the positive samples, as it is naively classifying everything as negative.
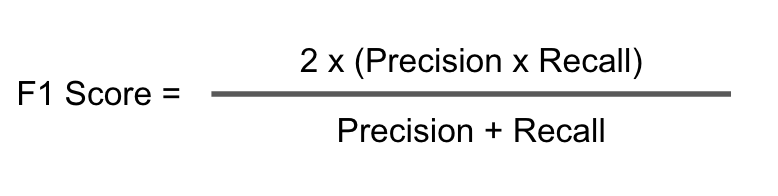
f1_positive=2*(prec_pos*recall_pos)/(prec_pos+recall_pos)f1_positive# nan because prec_pos is 0# orfromsklearn.metricsimportf1_scoref1_score(actual_values,predicted_values)# sklearn handles this nan and converts it to 0f1_negative=2*(prec_neg*recall_neg)/(prec_neg+recall_neg)f1_negativeactual_values=[1]*30+[2]*30+[3]*30+[4]*10# 30 samples of each class 1,2, and 3 and 10 samples of class 4predicted_values=random.choices([1,2,3,4],k=100)# 100 random samplesfromsklearn.metricsimportclassification_reportprint(classification_report(actual_values,predicted_values))Support: This columns tells you how many samples are in each class.
Macro Avg
For a multiclass classification problem, apart from the class-wise recall, precision, and f1 scores, we check the macro and weighted average recall, precision and f1 scores of the whole model. These scores help in choosing the best model for the task at hand.
In the above confusion matrix, if we do the average of precision column, we would get 0.23 as shown below. Similarly the averages of the other columns can be found out.
(0.39+0.21+0.32+0.00)/4.0Weighted Avg
Weighted average is average of weighted score of each column. For Example Precision column weighted average score is calculated by multiplying the precision value with corresponding number of samples and then taking the average as shown below.
(0.39*30+0.21*30+0.32*30+0.00*10)/100