Quantcast
Channel: Planet Python
Viewing all 22405 articles
Browse latest View live

Python Software Foundation: Start using 2FA and API tokens on PyPI

$
0
0
To increase the security of PyPI downloads, we have added two-factor authentication (2FA) as a login security option, and API tokens for uploading packages. This is thanks to a grant from the Open Technology Fund, coordinated by the Packaging Working Group of the Python Software Foundation.

If you maintain or own a project on the Python Package Index, you should start using these features. Click "help" on PyPI for instructions. (These features are also available on Test PyPI.)

Details and plans for the future:

2FA:

Two-factor authentication (2FA) makes your account more secure by requiring two things in order to log in: something you know and something you own.

In PyPI's case, "something you know" is your username and password, while "something you own" can be an application to generate a temporary code, or a security device (most commonly a USB key).

Why? This will help improve the security of your PyPI user accounts, and thus reduce the risk of vandals, spammers, and thieves gaining account access. Protecting login via the website safeguards against malicious changes to project ownership, deletion of old releases, and account takeovers.

PyPI's implementation of the WebAuthn standard and the TOTP standard mean you can use any TOTP authentication application and/or any 2FA device that meets the FIDO standard. (We launched WebAuthn support last year; this week it comes out of beta.)

Go to your account settings to add a second factor.
Add a second factor in your account settings.

Create a key name in the PyPI interface.
2FA only affects logging in via a web browser, and not (yet) package uploads.

API tokens:

In your Account Settings,
select "Add API token".
API tokens provide an alternative way (instead of username and password) to authenticate when uploading packages to PyPI. (We launched API token support last year; this week it comes out of beta.)

PyPI interface for adding an
API token for package upload.


Immediately after creating the API token,
PyPI gives the user one chance to copy it.
Why?These API tokens can only be used to upload packages to PyPI, and not to log in more generally. This makes it safer to automate package upload and store the credential in the cloud, since a thief who copies the token won't also gain the ability to delete the project, delete old releases, or add or remove collaborators. And, since the token is a long character string (with 32 bytes of entropy and a service identifier) that PyPI has securely generated on the server side, we vastly reduce the potential for credential reuse on other sites and for a bad actor to guess the token.

You can create a token for an entire PyPI user account, in which case, the token will work for all projects associated with that account. Alternatively, you can limit a token's scope to a specific project. That way, if a token is compromised, you can just revoke and recreate that token, instead of having to change your password in lots of automated processes.
PyPI token management interface

Go to your account settings to add an API token.  

Future:

In the future, PyPI will set and enforce a policy requiring users with two-factor authentication enabled to use API tokens to upload (rather than just their password, without a second factor). We do not yet know when we will make this policy change. When we do, we'll announce it.

Thanks:

Thanks to the Open Technology Fund for funding this work.

More donor-funded work is in progress on pip and PyPI, via the PSF's Packaging Working Group. Please sign up for the PyPI Announcement Mailing List for future updates.

IslandT: Create the input text box with tkinter

$
0
0

In the previous post, I have written a python program to create the database, earning table as well as input the first row of data into the earning table. In this chapter, I will create a simple UI to accept the user’s input so we do not need to hardcoded the values into the SQL query. I will leave the SQL commit code to the next chapter, we will only create a simple input’s UI in this chapter first.

A description box and the earning box of the Earning Input user interface

As you can see I will create the above simple UI with tkinter which can then be further upgraded in the future to include more stuff.

import tkinter as tk
from tkinter import ttk

win = tk.Tk()

win.title("Earning Input")

def submit():
    pass

#create label frame for ui
earn= ttk.Labelframe(win, text = "Daily Earning Input")
earn.grid(column=0, row=0, padx=4, pady=4)
# create label for description
dLabel = ttk.Label(earn, text="Description:").grid(column=0, row=0)
# create text box for description
description = tk.StringVar()
descriptionEntry = ttk.Entry(earn, width=13, textvariable=description)
descriptionEntry.grid(column=1, row=0)

# create label for earning
eLabel = ttk.Label(earn, text="Earning:").grid(column=2, row=0)
# create text box for earning
earning = tk.StringVar()
earningEntry = ttk.Entry(earn, width=13, textvariable=earning)
earningEntry.grid(column=3, row=0)
# create the action button
action = ttk.Button(earn, text="submit", command=submit)
action.grid(column=5, row=0)

win.resizable(0,0)

win.mainloop()

I will write a program to submit the above data to the earning table in the next chapter.

This website will update constantly because I have decided to make writing articles one of my income streams, so do subscribe to the RSS feed of this site, and also, do read the other topic besides the python related one if you love another topic as well!

This is just for your info, I have found out another free to use universal database browser which you can download and play around through this link! If you are a software developer and would like me to include one of your free product in my post that is related to your type of product, do leave your comment under that particular post, I would really like to help a developer likes you to promote your software, so drop me a suggestion!

Peter Bengtsson: JavaScript destructuring like Python kwargs with defaults

$
0
0

In Python

I'm sure it's been blogged about a buncha times before but, I couldn't find it, and I had to search too hard to find an example of this. Basically, what I'm trying to do is what Python does in this case, but in JavaScript:

defdo_something(arg="notset",**kwargs):print(f"arg='{arg.upper()}'")do_something(arg="peter")do_something(something="else")do_something()

In Python, the output of all this is:

arg='PETER'
arg='NOTSET'
arg='NOTSET'

It could also have been implemented in a more verbose way:

defdo_something(**kwargs):arg=kwargs.get("arg","notset")print(f"arg='{arg.upper()}'")

This more verbose format has the disadvantage that you can't quickly skim it and see and what the default is. That thing (arg = kwargs.get("arg", "notset")) might happen far away deeper in the function, making it hard work to spot the default.

In JavaScript

Here's the equivalent in JavaScript (ES6?):

functiondoSomething({arg="notset",...kwargs}={}){return`arg='${arg.toUpperCase()}'`;}console.log(doSomething({arg:"peter"}));console.log(doSomething({something:"else"}));console.log(doSomething());

Same output as in Python:

arg='PETER'
arg='NOTSET'
arg='NOTSET'

Notes

I'm still not convinced I like this syntax. It feels a bit too "hip" and too one-liner'y. But it's also pretty useful.

Mind you, the examples here are contrived because they're so short in terms of the number of arguments used in the function.
A more realistic thing like be a function that lists, upfront, all the possible parameters and for some of them, it wants to point out some defaults. E.g.

functionprocessFolder({source,destination="/tmp",quiet=false,verbose=false}={}){console.log({source,destination,quiet,verbose});// outputs// { source: '/user', destination: '/tmp', quiet: true, verbose: false }}console.log(processFolder({source:"/user",quiet:true}));

One could maybe argue that arguments that don't have a default are expected to always be supplied so they can be regular arguments like:

functionprocessFolder(source,{destination="/tmp",quiet=false,verbose=false}={}){console.log({source,destination,quiet,verbose});// outputs// { source: '/user', destination: '/tmp', quiet: true, verbose: false }}console.log(processFolder("/user",{quiet:true}));

But, I quite like keeping all arguments in an object. It makes it easier to write wrapper functions and I find this:

setProfile("My biography here",false,193.5,230,["anders","bengt"],"South Carolina");

...harder to read than...

setProfile({bio:"My biography here",dead:false,height:193.5,weight:230,middlenames:["anders","bengt"],state:"South Carolina"});

Catalin George Festila: Python 3.7.5 : Is Django the best web framework?

$
0
0
This is the question for today in order to lineup the Django features with any web framework from my point of view. Let's start with a brief introduction to this framework: Django was created in the fall of 2003, when the web programmers at the Lawrence Journal-World newspaper, Adrian Holovaty and Simon Willison, began using Python to build applications. Jacob Kaplan-Moss was hired early in

Catalin George Festila: Python 3.7.5 : Django security issues - part 001.

$
0
0
Django like any website development and framework implementation requires security settings and configurations. Today I will present some aspects of this topic and then I will come back with other information. 1. First, check your security vulnerabilities by the following command: [mythcat@desk django]$ source env/bin/activate (env) [mythcat@desk django]$ cd mysite (env) [mythcat@desk mysite]$

Python Circle: How to display flash messages in Django templates

$
0
0
flash messages in Django template, one-time notifications in Django template, messages framework Django, displaying success message in Django, error message display in Django

Codementor: Why ASGI is Replacing WSGI in Django

$
0
0
Talks about why ASGI is replacing WSGI for Django development and the future it holds for Django development moving forward.

Python Circle: Top 5 Python Books

$
0
0
top 10 python programming books, List of python books to start with, Start with a python book collection, Buy best python books, Top and best python books,

Python Circle: Encryption-Decryption in Python Django

$
0
0
How to encrypt and decrypt the content in Django, Encrypting the critical information in Django App, Encrypting username, email and password in Django, Django security

Python Circle: How to set a variable in Django template

$
0
0
Declaring a new variable in Django template, Set the value of a variable in Django template, using custom template tag in Django, Defining variables in Django template tag

Peter Hoffmann: Understand predicate pushdown on row group level in Parquet with pyarrow and python

$
0
0

Demo Dataset

We are using the NY Taxi Dataset throughout this blog post because it is a real world dataset, has a reasonable size and some nice properties like different datatypes and includes some messy data (like all real world data engineering problems).

mkdirinputcdinputforiin{01..12};dowgetgethttps://s3.amazonaws.com/nyc-tlc/trip+data/yellow_tripdata_2018-$i.csvdone

Looking at the first rows of the data gives us some insight about the columns and data format

$head-n4input/yellow_tripdata_2019-01.csvVendorID,tpep_pickup_datetime,tpep_dropoff_datetime,passenger_count,trip_distance,RatecodeID,store_and_fwd_flag,PULocationID,DOLocationID,payment_type,fare_amount,extra,mta_tax,tip_amount,tolls_amount,improvement_surcharge,total_amount,congestion_surcharge1,2019-01-0100:46:40,2019-01-0100:53:20,1,1.50,1,N,151,239,1,7,0.5,0.5,1.65,0,0.3,9.95,1,2019-01-0100:59:47,2019-01-0101:18:59,1,2.60,1,N,239,246,1,14,0.5,0.5,1,0,0.3,16.3,2,2018-12-2113:48:30,2018-12-2113:52:40,3,.00,1,N,236,236,1,4.5,0.5,0.5,0,0,0.3,5.8,

Each of the files is roughly 700MiB uncompressed data:

$du-shinput/yellow_tripdata_2018-0*737Minput/yellow_tripdata_2018-01.csv715Minput/yellow_tripdata_2018-02.csv794Minput/yellow_tripdata_2018-03.csv784Minput/yellow_tripdata_2018-04.csv777Minput/yellow_tripdata_2018-05.csv734Minput/yellow_tripdata_2018-06.csv661Minput/yellow_tripdata_2018-07.csv661Minput/yellow_tripdata_2018-08.csv678Minput/yellow_tripdata_2018-09.csv

To convert the data to parquet we are going to use pandas to read the csv and store it in one large parquet file:

importglobimportpandasaspdfiles=glob.glob("input/yellow_tripdata_2018-*.csv")defread_csv(filename):returnpd.read_csv(filename,dtype={"store_and_fwd_flag":"bool"},parse_dates=["tpep_pickup_datetime","tpep_dropoff_datetime"],index_col=False,infer_datetime_format=True,true_values=["Y"],false_values=["N"],)dfs=list(map(read_csv,files))df=pd.concat(dfs)df.to_parquet("yellow_tripdata_2018.parquet")

The resulting parquet file has a size of 2.2GiB, while the sum of the original CSV files was 11GiB. Pandas supports two parquet implementations, fastparquet and pyarrow. They both have strengths and weaknesses. A comparison should be topic of an other blog post, and we are going to use pyarrow to analyze the data.

pyarrow can open a parquet file without directly reading all the data. It exposes metadata and only reads the necessary byte ranges of the file to get this information. This is extremely helpful when you are working with parquet files that are not available locally and stored in a remote location (like Amazon S3 or Azure Blob Storage), because you are only reading some kB instead of gigabytes of data to understand your dataset.

importpyarrow.parquetaspqfilename="yellow_tripdata_2018.parquet"pq_file=pq.ParquetFile(filename)data=[["columns:",pq_file.metadata.num_columns],["rows:",pq_file.metadata.num_rows],["row_roups:",pq_file.metadata.num_row_groups]]

So we are working with roughly 10 million records, 18 columns and the file has 2 row groups.

columns:18rows:102804250row_roups:2

The next step is to have a look at the schema of the parquet file:

s=pq_file.metadata.schemadata=[[s.column(i).name,s.column(i).physical_type,s.column(i).logical_type]foriinrange(len(s))]
Columnphysicallogical
VendorIDINT64NONE
tpep_pickup_datetimeINT64TIMESTAMP_MILLIS
tpep_dropoff_datetimeINT64TIMESTAMP_MILLIS
passenger_countINT64NONE
trip_distanceDOUBLENONE
RatecodeIDINT64NONE
store_and_fwd_flagBOOLEANNONE
PULocationIDINT64NONE
DOLocationIDINT64NONE
payment_typeINT64NONE
fare_amountDOUBLENONE
extraDOUBLENONE
mta_taxDOUBLENONE
tip_amountDOUBLENONE
tolls_amountDOUBLENONE
improvement_surchargeDOUBLENONE
total_amountDOUBLENONE

Each column has a physical type that defines how the column is stored on disk and an optional logical type that is used to determine the actual data type. In case of the tpep_pickup_datetime and tpep_pickup_datetime the values are stored as INT64 types on disk but are represented as timestamps in pandas.

Logical types are used to extend the types that parquet can be used to store, by specifying how the primitive types should be interpreted. This keeps the set of primitive types to a minimum and reuses parquet's efficient encodings. For example, strings are stored as byte arrays (binary) with a UTF8 annotation, the parquet logical type definitions provides comprehensive documentation.

Now let's dive a little deeper into the file. A parquet file consists of one ore more row groups, which are a logical horizontal partitioning of the data into rows.

s=pq_file.metadata.schemadata=[]forrginrange(pq_file.metadata.num_row_groups):rg_meta=pq_file.metadata.row_group(rg)data.append([rg,rg_meta.num_rows,sizeof_fmt(rg_meta.total_byte_size)])

As we have written the parquet file with the default values in pandas we get row groups with a size on disk between 512MiB an 1,5GiB.

rowgrouprowssize
0671088641.4GiB
135695386753.0MiB

To understand the defaults of the row group sizing, a little bit of historical context is necessary. The parquet file format was developed as a columnar data storage format of the Apache Hadoop ecosystem and its underlying Hadoop distributed file system (HDFS):

Larger row groups allow for larger column chunks which makes it possible to do larger sequential IO. Larger groups also require more buffering in the write path (or a two pass write). We recommend large row groups (512MB - 1GB). Since an entire row group might need to be read, we want it to completely fit on one HDFS block. Therefore, HDFS block sizes should also be set to be larger. An optimized read setup would be: 1GB row groups, 1GB HDFS block size, 1 HDFS block per HDFS file. #

When working with parquet in python one does typically not use HDFS as a storage backend, but either the local file system or a cloud blob storage like Amazon S3 or Azure blob store. Depending on the read scenarios different row group sizes make sense.

Instead of concatenating the csv files in pandas and write them in one batch, on can use pyarrow.ParquetWriter directly to control how many rowgroups are written:

importpandasaspdimportpyarrowaspaimportpyarrow.parquetaspqmonths=range(1,13)defread_csv(month):filename="input/yellow_tripdata_2018-{:02d}.csv".format(month)df=pd.read_csv(filename,dtype={"store_and_fwd_flag":"bool"},parse_dates=["tpep_pickup_datetime","tpep_dropoff_datetime"],index_col=False,infer_datetime_format=True,true_values=["Y"],false_values=["N"],)returndf[(df['tpep_pickup_datetime'].dt.year=2018)&(df['tpep_pickup_datetime'].dt.month=month)]dfs=list(map(read_csv,months))table=pa.Table.from_pandas(dfs[0],preserve_index=False)writer=pq.ParquetWriter('yellow_tripdata_2018-rowgroups.parquet',table.schema)fordfindfs:table=pa.Table.from_pandas(df,preserve_index=False)writer.write_table(table)writer.close()

I have also added some data cleansing because, as mentioned earlier, the taxi dataset includes some messy data and we only want to have rows within a monthly data set with the correct pickup_datetime.

If we analyze the new parquet file again we can see that we now have a row group fore each month of data:

rowgrouprowstotal_byte_size
08492076152.0MiB
18173231150.5MiB
28040133148.1MiB
39430376169.8MiB
48821105162.4MiB
57849748142.9MiB
69305515168.0MiB
78145164149.8MiB
89224063167.1MiB
97849134142.9MiB
108713831157.8MiB
118759874157.9MiB

Next to the data in the rowgroups the parquet format specifies some metadata that is written per rowgroup:

rg_meta=pq_file.metadata.row_group(0)rg_meta.column(0)

Per column we can retrieve metadata like compression, sizing and datatype, but also statistical information about the values stored in the rowgroup for the particular column.

<pyarrow._parquet.ColumnChunkMetaDataobjectat0x7fa958ab72d0>file_offset:43125536file_path:physical_type:INT64num_values:8759557path_in_schema:tpep_pickup_datetimeis_stats_set:Truestatistics:<pyarrow._parquet.Statisticsobjectat0x7fa958ab7510>has_min_max:Truemin:2001-01-0511:45:23max:2018-01-3123:59:57null_count:0distinct_count:0num_values:8759557physical_type:INT64logical_type:Timestamp(isAdjustedToUTC=false,timeUnit=microseconds,is_from_converted_type=false,force_set_converted_type=false)converted_type(legacy):NONEcompression:SNAPPYencodings:('PLAIN_DICTIONARY','PLAIN','RLE','PLAIN')has_dictionary_page:Truedictionary_page_offset:1312236data_page_offset:2117164total_compressed_size:41813300total_uncompressed_size:68701768

Looking at the min and max statistics of the tpep_pickup_datetime:

column=1# tpep_pickup_datetimedata=[["rowgroup","min","max"]]forrginrange(pq_file.metadata.num_row_groups):rg_meta=pq_file.metadata.row_group(rg)data.append([rg,str(rg_meta.column(column).statistics.min),str(rg_meta.column(column).statistics.max)])print_table(data)

The statistics show an interesting property. The values per rowgroup are disjunct. This means without reading the full data you can know which values to expect in which rowgroup.

rowgroupminmax
02018-01-01 00:00:002018-01-31 23:59:57
12018-02-01 00:00:002018-02-28 23:59:58
22018-03-01 00:00:002018-03-31 23:59:57
32018-04-01 00:00:002018-04-30 23:59:58
42018-05-01 00:00:002018-05-31 23:59:59
52018-06-01 00:00:002018-06-30 23:59:59
62018-07-01 00:00:002018-07-31 23:59:59
72018-08-01 00:00:002018-08-31 23:59:59
82018-09-01 00:00:002018-09-30 23:59:59
92018-10-01 00:00:002018-10-31 23:59:58
102018-11-01 00:00:002018-11-30 23:59:59
112018-12-01 00:00:002018-12-31 23:59:58

If columns are sorted and/or rowgroups have disjunct values in a dataset, readers can take advantagea of this through a feature called predicate pushdown. To get all taxi trips on a certain day 2018-02-20 the parquet reader can now look at the rowgroup statistics, compare the predicate tpep_pickup_datetime.min <= 2019-02-20 and tpep_pickup_datetime.max >= 2019-02-20 against it and only read the parts of the file that potentially include rows for the day. In our case one would only have to read the rowgroup 1 and by this 150MiB instead of 2.1 GiB.

In contrast if we print the statistic for the column trip_distance:

rowgroupminmax
00.0189483.84
10.01061.2
20.0302.8
30.0943.5
40.0910.8
50.0833.1
60.07655.76
70.05381.5
80.0329.63
90.0302.0
100.0932.9
110.0602.3

Even if readers would only be interested in rows with a certaintrip_distance, one would have to read the whole dataset most of the time. Only for distances greater 1000 one could skip some of the rowgroups.

Summary

Query engines on parquet files like Hive, Presto or Dremio provide predicate pushdown out of the box to speed up query times and reduce I/O.

In the python ecosystem fastparquet has support for predicate pushdown on row group level. pyarrow has an open ticket for an efficient implementation in the parquet C++ reader.

Implementing predicate pushdown in python on top of the exposed statistics is not that hard. In my team we have done this within kartothek to speed up reads from large datasets from the Azure Blob storage.

Weekly Python StackOverflow Report: (ccxi) stackoverflow python report

$
0
0

Simple is Better Than Complex: How to Use Chart.js with Django

$
0
0

Chart.js is a cool open source JavaScript library that helps you render HTML5 charts. It is responsive and counts with 8 different chart types.

In this tutorial we are going to explore a little bit of how to make Django talk with Chart.js and render some simple charts based on data extracted from our models.

Installation

For this tutorial all you are going to do is add the Chart.js lib to your HTML page:

<script src="https://cdn.jsdelivr.net/npm/chart.js@2.9.3/dist/Chart.min.js"></script>

You can download it from Chart.js official website and use it locally, or you can use it from a CDN using the URL above.

Example Scenario

I’m going to use the same example I used for the tutorial How to Create Group By Queries With Django ORM which is a good complement to this tutorial because actually the tricky part of working with charts is to transform the data so it can fit in a bar chart / line chart / etc.

We are going to use the two models below, Country and City:

classCountry(models.Model):name=models.CharField(max_length=30)classCity(models.Model):name=models.CharField(max_length=30)country=models.ForeignKey(Country,on_delete=models.CASCADE)population=models.PositiveIntegerField()

And the raw data stored in the database:

cities
idnamecountry_idpopulation
1Tokyo2836,923,000
2Shanghai1334,000,000
3Jakarta1930,000,000
4Seoul2125,514,000
5Guangzhou1325,000,000
6Beijing1324,900,000
7Karachi2224,300,000
8Shenzhen1323,300,000
9Delhi2521,753,486
10Mexico City2421,339,781
11Lagos921,000,000
12São Paulo120,935,204
13Mumbai2520,748,395
14New York City2020,092,883
15Osaka2819,342,000
16Wuhan1319,000,000
17Chengdu1318,100,000
18Dhaka417,151,925
19Chongqing1317,000,000
20Tianjin1315,400,000
21Kolkata2514,617,882
22Tehran1114,595,904
23Istanbul214,377,018
24London2614,031,830
25Hangzhou1313,400,000
26Los Angeles2013,262,220
27Buenos Aires813,074,000
28Xi'an1312,900,000
29Paris612,405,426
30Changzhou1312,400,000
31Shantou1312,000,000
32Rio de Janeiro111,973,505
33Manila1811,855,975
34Nanjing1311,700,000
35Rhine-Ruhr1611,470,000
36Jinan1311,000,000
37Bangalore2510,576,167
38Harbin1310,500,000
39Lima79,886,647
40Zhengzhou139,700,000
41Qingdao139,600,000
42Chicago209,554,598
43Nagoya289,107,000
44Chennai258,917,749
45Bangkok158,305,218
46Bogotá277,878,783
47Hyderabad257,749,334
48Shenyang137,700,000
49Wenzhou137,600,000
50Nanchang137,400,000
51Hong Kong137,298,600
52Taipei297,045,488
53Dallas–Fort Worth206,954,330
54Santiago146,683,852
55Luanda236,542,944
56Houston206,490,180
57Madrid176,378,297
58Ahmedabad256,352,254
59Toronto56,055,724
60Philadelphia206,051,170
61Washington, D.C.206,033,737
62Miami205,929,819
63Belo Horizonte15,767,414
64Atlanta205,614,323
65Singapore125,535,000
66Barcelona175,445,616
67Munich165,203,738
68Stuttgart165,200,000
69Ankara25,150,072
70Hamburg165,100,000
71Pune255,049,968
72Berlin165,005,216
73Guadalajara244,796,050
74Boston204,732,161
75Sydney105,000,500
76San Francisco204,594,060
77Surat254,585,367
78Phoenix204,489,109
79Monterrey244,477,614
80Inland Empire204,441,890
81Rome34,321,244
82Detroit204,296,611
83Milan34,267,946
84Melbourne104,650,000
countries
idname
1Brazil
2Turkey
3Italy
4Bangladesh
5Canada
6France
7Peru
8Argentina
9Nigeria
10Australia
11Iran
12Singapore
13China
14Chile
15Thailand
16Germany
17Spain
18Philippines
19Indonesia
20United States
21South Korea
22Pakistan
23Angola
24Mexico
25India
26United Kingdom
27Colombia
28Japan
29Taiwan

Example 1: Pie Chart

For the first example we are only going to retrieve the top 5 most populous cities and render it as a pie chart. In this strategy we are going to return the chart data as part of the view context and inject the results in the JavaScript code using the Django Template language.

views.py

fromdjango.shortcutsimportrenderfrommysite.core.modelsimportCitydefpie_chart(request):labels=[]data=[]queryset=City.objects.order_by('-population')[:5]forcityinqueryset:labels.append(city.name)data.append(city.population)returnrender(request,'pie_chart.html',{'labels':labels,'data':data,})

Basically in the view above we are iterating through the City queryset and building a list of labels and a list of data. Here in this case the data is the population count saved in the City model.

For the urls.py just a simple routing:

urls.py

fromdjango.urlsimportpathfrommysite.coreimportviewsurlpatterns=[path('pie-chart/',views.pie_chart,name='pie-chart'),]

Now the template. I got a basic snippet from the Chart.js Pie Chart Documentation.

pie_chart.html

{% extends 'base.html' %}

{% block content %}
  <divid="container"style="width: 75%;"><canvasid="pie-chart"></canvas></div><script src="https://cdn.jsdelivr.net/npm/chart.js@2.9.3/dist/Chart.min.js"></script><script>varconfig={type:'pie',data:{datasets:[{data:{{data|safe}},backgroundColor:['#696969','#808080','#A9A9A9','#C0C0C0','#D3D3D3'],label:'Population'}],labels:{{labels|safe}}},options:{responsive:true}};window.onload=function(){varctx=document.getElementById('pie-chart').getContext('2d');window.myPie=newChart(ctx,config);};</script>

{% endblock %}

In the example above the base.html template is not important but you can see it in the code example I shared in the end of this post.

This strategy is not ideal but works fine. The bad thing is that we are using the Django Template Language to interfere with the JavaScript logic. When we put {{data|safe}} we are injecting a variable that came from the server directly in the JavaScript code.

The code above looks like this:

Pie Chart


Example 2: Bar Chart with Ajax

As the title says, we are now going to render a bar chart using an async call.

views.py

fromdjango.shortcutsimportrenderfromdjango.db.modelsimportSumfromdjango.httpimportJsonResponsefrommysite.core.modelsimportCitydefhome(request):returnrender(request,'home.html')defpopulation_chart(request):labels=[]data=[]queryset=City.objects.values('country__name').annotate(country_population=Sum('population')).order_by('-country_population')forentryinqueryset:labels.append(entry['country__name'])data.append(entry['country_population'])returnJsonResponse(data={'labels':labels,'data':data,})

So here we are using two views. The home view would be the main page where the chart would be loaded at. The other view population_chart would be the one with the sole responsibility to aggregate the data the return a JSON response with the labels and data.

If you are wondering about what this queryset is doing, it is grouping the cities by the country and aggregating the total population of each country. The result is going to be a list of country + total population. To learn more about this kind of query have a look on this post: How to Create Group By Queries With Django ORM

urls.py

fromdjango.urlsimportpathfrommysite.coreimportviewsurlpatterns=[path('',views.home,name='home'),path('population-chart/',views.population_chart,name='population-chart'),]

home.html

{%extends'base.html'%}{%blockcontent%}<divid="container"style="width: 75%;"><canvasid="population-chart"data-url="{%url'population-chart'%}"></canvas></div><script src="https://code.jquery.com/jquery-3.4.1.min.js"></script><script src="https://cdn.jsdelivr.net/npm/chart.js@2.9.3/dist/Chart.min.js"></script><script>$(function(){var$populationChart=$("#population-chart");$.ajax({url:$populationChart.data("url"),success:function(data){varctx=$populationChart[0].getContext("2d");newChart(ctx,{type:'bar',data:{labels:data.labels,datasets:[{label:'Population',backgroundColor:'blue',data:data.data}]},options:{responsive:true,legend:{position:'top',},title:{display:true,text:'Population Bar Chart'}}});}});});</script>{%endblock%}

Now we have a better separation of concerns. Looking at the chart container:

<canvasid="population-chart"data-url="{%url'population-chart'%}"></canvas>

We added a reference to the URL that holds the chart rendering logic. Later on we are using it to execute the Ajax call.

var$populationChart=$("#population-chart");$.ajax({url:$populationChart.data("url"),success:function(data){// ...}});

Inside the success callback we then finally execute the Chart.js related code using the JsonResponse data.

Bar Chart


Conclusions

I hope this tutorial helped you to get started with working with charts using Chart.js. I published another tutorial on the same subject a while ago but using the Highcharts library. The approach is pretty much the same: How to Integrate Highcharts.js with Django.

If you want to grab the code I used in this tutorial you can find it here: github.com/sibtc/django-chartjs-example.

Codementor: How To Publish Your Own Python Package

$
0
0
Proper guide with demonstration of each step of HOW TO PUBLISH A PYTHON PACKAGE on PyPI.

Ionel Cristian Maries: Is there anything safe in python?

$
0
0

In the process of working on Hunter I have found many strange things from merely trying to do a repr on objects that are passed around. Code blowing up with an exception is the least of your concerns. Take a look at this:

classlazy(object):def__init__(self,fun,*args,**kwargs):self._fun=funself._args=argsself._kwargs=kwargsdef__call__(self):returnself.evaluate()defevaluate(self):returnself._fun(*self._args,**self._kwargs)def__repr__(self):returnrepr(self())

Simply doing a repr on that will change the flow of the program, exactly what you don't want a debugging tool to do!

So then I tried something like:

defrudimentary_repr(obj):ifisinstance(obj,dict):...elifisinstance(obj,list):...elif...# goes on for a while...else:# give the not very useful '<Something object at 0x123>'returnobject.__repr__(obj)

Add a simple depth check to deal with deep or infinite recursion and you're good right? I went for a simple depth check instead of pprint's recursion checker (that stores id of objects):

defrudimentary_repr(obj,maxdepth=5):ifnotmaxdepth:return'...'newdepth=maxdepth-1# then pass around newdepth, easy-peasy

At this point I thought the only real problem was how to reduce the number of branches and figure out on which objects it's safe to call repr (to avoid reimplementing __repr__ of everything interesting).

Then I added this, hoping this would save me lots of typing:

elifnothasattr(obj,'__dict__'):returnrepr(obj)

No __dict__ doesn't necessarily mean no state, but I hoped no one with do crummy stuff in __repr__ if they have an dict-less object.

But then I found this little fella:

classApiModule(ModuleType):@propertydef__dict__(self):# force all the content of the module# to be loaded when __dict__ is read...

And doubled down in the terrible idea of checking for a __dict__ (instead of hasattr(obj, '__dict__') I'd use hasdict(type(obj))):

defhasdict(obj_type,obj,tolerance=25):"""    A contrived mess to check that object doesn't have a __dit__ but avoid checking it if any ancestor is evil enough to    explicitly define __dict__"""ancestor_types=deque()whileobj_typeisnottypeandtolerance:ancestor_types.appendleft(obj_type)obj_type=type(obj_type)tolerance-=1forancestorinancestor_types:__dict__=getattr(ancestor,'__dict__',None)if__dict__isnotNone:if'__dict__'in__dict__:returnTruereturnhasattr(obj,'__dict__')

I used that for a while until I came to the sad realization that you can't really trust anything. Behold:

classLazyObject(object):# Need to pretend to be the wrapped class, for the sake of objects that# care about this (especially in equality tests)__class__=property(new_method_proxy(operator.attrgetter("__class__")))

What exactly is going on there? A simplified example to illustrate the problem:

>>> classSurprise(object):... @property... def__class__(self):... print('Boom!')...>>> p=Surprise()>>> isinstance(p,dict)Boom!False

At this point it became clear that the hasdict idea wasn't going to fly for long so I ripped that out as well.

New plan:

  • Don't bother showing details for subclasses of builtin types (like dict, list etc). Subclasses could do any of the crazy things shown above.
  • Use type instead of isinstance. For example: to check if it's a Exception instance just check if BaseException is in type's MRO. As I'm typing this I realise someone could stick a descriptor into the args attribute, damn it. Perhaps getattr_static would solve it.
  • Use repr only on objects deemed to have a safe builtin type. Start with builtins, io, socket, _socket.

What I got now:

defsafe_repr(obj,maxdepth=5):ifnotmaxdepth:return'...'obj_type=type(obj)obj_type_type=type(obj_type)newdepth=maxdepth-1# only represent exact builtins# (subclasses can have side-effects due to __class__ being# a property, __instancecheck__, __subclasscheck__ etc)ifobj_typeisdict:return'{%s}'%', '.join('%s: %s'%(safe_repr(k,maxdepth),safe_repr(v,newdepth))fork,vinobj.items())elifobj_typeislist:return'[%s]'%', '.join(safe_repr(i,newdepth)foriinobj)elifobj_typeistuple:return'(%s%s)'%(', '.join(safe_repr(i,newdepth)foriinobj),','iflen(obj)==1else'')elifobj_typeisset:return'{%s}'%', '.join(safe_repr(i,newdepth)foriinobj)elifobj_typeisfrozenset:return'%s({%s})'%(obj_type.__name__,', '.join(safe_repr(i,newdepth)foriinobj))elifobj_typeisdeque:return'%s([%s])'%(obj_type.__name__,', '.join(safe_repr(i,newdepth)foriinobj))elifobj_typein(Counter,OrderedDict,defaultdict):return'%s({%s})'%(obj_type.__name__,', '.join('%s: %s'%(safe_repr(k,maxdepth),safe_repr(v,newdepth))fork,vinobj.items()))elifobj_typeistypes.MethodType:# noqaself=obj.__self__name=getattr(obj,'__qualname__',None)ifnameisNone:name=obj.__name__return'<%sbound method %s of %s>'%('un'ifselfisNoneelse'',name,safe_repr(self,newdepth))elifobj_type_typeistypeandBaseExceptioninobj_type.__mro__:return'%s(%s)'%(obj_type.__name__,', '.join(safe_repr(i,newdepth)foriinobj.args))elifobj_type_typeistypeand \
         obj_typeisnotInstanceTypeand \
         obj_type.__module__in(builtins.__name__,'io','socket','_socket'):# hardcoded list of safe things. note that isinstance ain't used# (and we don't trust subclasses to do the right thing in __repr__)returnrepr(obj)else:returnobject.__repr__(obj)

The problematic code examples are taken out of popular projects like Celery, Pytest and Django but I don't think it matters who does it. What do you think?


IslandT: Link together the Tkinter user interface and database Input class

$
0
0

In this chapter, we will create the Input class which has a few methods used to create a database and the earning table as well as an insert method to insert earning values into that earning table. After that, we will create an object of that class inside the main program which can be used to create a database and the earning table and then insert the user inputs into that earning table.

First of all, this will be the final folder structure once we have created the input class and created the database’s table with some values in it.

The folder and files of this project

I am using PyCharm 2019.3.1 Community Edition which is a free python editor with a great user interface to create this project.

We have already created the python program used to generate the database, earning table and to submit the user input to the earning table in the previous chapter. In this chapter, we just need to create a class which will interact with the Tkinter program to perform the above tasks.

import sqlite3
from datetime import datetime

class Input:
    def __init__(self, description, earning):
        self.description = description
        self.earning = earning

    def setting(self):
        conn = sqlite3.connect('daily_earning.db')
        print("Opened database successfully")
        try:
            conn.execute('''CREATE TABLE DAILY_EARNING_CHART
                 (ID INTEGER PRIMARY KEY AUTOINCREMENT,
                 DESCRIPTION    TEXT (50)   NOT NULL,
                 EARNING    TEXT  NOT NULL,
                 TIME   TEXT NOT NULL);''')
        except:
            pass

        print("Table created successfully")

        conn.close()

    def submit(self): # Insert values into earning table
        try:
            sqliteConnection = sqlite3.connect('daily_earning.db')
            cursor = sqliteConnection.cursor()
            print("Successfully Connected to SQLite")

            sqlite_insert_query = "INSERT INTO DAILY_EARNING_CHART (DESCRIPTION,EARNING,TIME) VALUES ('" + self.description + "','"+ self.earning + "',datetime('now', 'localtime'))"

            count = cursor.execute(sqlite_insert_query)
            sqliteConnection.commit()
            print("Record inserted successfully into DAILY_EARNING_CHART table", cursor.rowcount)
            cursor.close()

        except sqlite3.Error as error:
            print("Failed to insert earning data into sqlite table", error)
        finally:
            if (sqliteConnection):
                sqliteConnection.close()
                print("The SQLite connection is closed")

The above class will allow us to create an object in which the main program will be able to use to call various methods that will then create the database, earning table and insert values into that table.

import tkinter as tk
from tkinter import ttk

from Input import Input

win = tk.Tk()

win.title("Earning Input")

def submit():
    if(description.get()!='' and earning.get()!=""):
        sub_mit = Input(description.get(), earning.get())
        sub_mit.setting()
        sub_mit.submit()
    else:
        print("You need to enter a value!")

#create label frame for ui
earn= ttk.Labelframe(win, text = "Daily Earning Input")
earn.grid(column=0, row=0, padx=4, pady=4)
# create label for description
dLabel = ttk.Label(earn, text="Description:").grid(column=0, row=0)
# create text box for description
description = tk.StringVar()
descriptionEntry = ttk.Entry(earn, width=13, textvariable=description)
descriptionEntry.grid(column=1, row=0)

# create label for earning
eLabel = ttk.Label(earn, text="Earning:").grid(column=2, row=0)
# create text box for earning
earning = tk.StringVar()
earningEntry = ttk.Entry(earn, width=13, textvariable=earning)
earningEntry.grid(column=3, row=0)
# create the action button
action = ttk.Button(earn, text="submit", command=submit)
action.grid(column=5, row=0)

win.resizable(0,0)

win.mainloop()

The Input class and the main python program has taken care of the followings:-

  • If the table and database have not been created yet, then create them.
  • If there is no input from the user then just skip the submit process.
  • Always inform the programmer whether the program has successfully created a database or inserted values or not.
Let us start the Tkinter user interface and insert some values
The program has succeeded in creating a database, earning table and inserting the values into the earning table
Open DB Browser and view the outcome

DB Browser is a great tool and we will stick with this tool for a while, we will continue to modify our project in the next chapter before moving onward.

Mike Driscoll: PyDev of the Week: Sebastián Ramírez

$
0
0

This week we welcome Sebastián Ramírez (@tiangolo) as our PyDev of the Week! Sebastián is the creator of the FastAPI Python web framework. He maintains his own website/blog which you should check out if you have some free time. You can also see his open source projects there. You can also see what projects he is contributing to over on Github.

Let’s take a few moments to get to know Sebastián better!

Sebastián Ramírez

Can you tell us a little about yourself (hobbies, education, etc):
Hey! I’m Sebastián Ramírez, I’m from Colombia, and currently living in Berlin, Germany.
I was “homeschooled” since I was a kid, there wasn’t even a term for that, it wasn’t common. I didn’t go to school nor university, I studied everything at home. At about (I think) 14 I started fiddling with video edition and visual effects, some music production, and then graphic design to help with my parent’s business.
Then I thought that building a website should be almost the same …soon I realized I had to learn some of those scary “programming languages”. HTML, CSS, and JavaScript (“but!!! HTML and CSS are not…” I know, I know). But soon I was able to write a very short text, in a text file, and use it to make a browser show a button, that when clicked would show a pop-up saying “Hello world!”… I was so proud and excited about it, I guess it was a huge “I maked these” moment for me. I still feel that rush, that excitement from time to time. That’s what makes me keep loving code.
I also like to play videogames and watch movies, but many times I end up just coding in my free time too. I’m boring like that… 😂

Why did you start using Python?

At some point, I was taking several (too many) courses on CourseraedX, and Udacity. I knew mainly frontend vanilla JavaScript (Node.js was just starting), so I did all the exercises for the Cryptography, Algorithms, and other courses with JavaScript running in a browser, it sounds a bit crazy now.
Then I took Andrew Ng’s ML course on Coursera, it used Octave (kinda Matlab) and it taught me enough Octave/Matlab for the course, and also that learning a new language was not so terrible. But then an AI course from Berkeley/edX required Python… so I took the Python crash course that was embedded (it was just like one page). And I went into the AI course with that. I loved the course, and with it, I started to love Python. I had to read a lot of Python docs, tutorials, StackOverflow, etc. just to be able to keep the pace, but I loved it. After that, I took an MIT/edX Python course and several others.
And I just kept learning and loving Python more and more.

What other programming languages do you know and which is your favorite?

I’m quite fond of JavaScript as it was my first language. I have also used some compile-to-JS languages like CoffeeScript, TypeScript. I have also ended up doing quite some Bash for Linux and Docker.
I really like TypeScript, and now I almost never do plain JS without TS, I love having autocompletion everywhere and type checks for free. I naturally got super excited when optional type hints for Python were released as a Christmas gift in 2016. And 2 years later FastAPI came to be, heavily based on them.

What projects are you working on now?

I put a lot of my free time to FastAPI and sibling projects, and also some of the other open source tools I’ve built.
Right now I’m working for Explosion AI. They are the creators of spaCy, the open source, industrial-strength, Natural Language Processing package.
At work, I’m currently on the team building the teams version of Prodigy, a commercial tool for radically efficient machine teaching, using Active (Machine) Learning.
But as open source is very important for the company (because they’re awesome like that), I also devote part of my working time to FastAPI and family.

Which Python libraries are your favorite (core or 3rd party)?

Core, I would say typing, as it’s relatively new and it deserves more attention, I think not many people know that those optional type hints are what powers autocompletion and automatic type checks for errors in editors. Most of the developers love those features, but a few know that type hints are what powers them.
3rd party, I think naturally Starlette and Pydantic, as they power FastAPI.
But I think Pydantic also deserves a lot more attention, even outside of FastAPI. It’s an amazing library, really easy to use, and saves a lot of time debugging, validating, documenting, and parsing data. It’s also great for managing application settings and just moving data around in an app. Imagine using deeply nested dicts and lists of values, but not having to remember what is what everywhere (“did I write ‘username’ or ‘user_name’ as the key in the other function?” ), just having autocomplete for everything and automatic error checks (type checks).
I recently built a GitHub action to help me manage issues, and most of the work ended up being done automatically by Pydantic. It also works great for data science, cleaning and structuring data.
This list could probably grow a lot, but some highlights:
* Dev utils: Poetry or Pipenv, Black, Isort, Flake8, Autoflake8, Mypy, Pytest, Pytest-cov
* For docs: Mkdocs with Mkdocs-material and Markdown-include
* Others: Cookiecutter, Requests or HTTPX, Uvicorn
* Data Science/Processing, ML: Keras with TensorFlow or PyTorch, Numpy, PyAV, Pandas, Numba, and of course, spaCy and Prodigy

Is there anything else you’d like to say?

I love the Python community, I think it’s a friendly ecosystem and I would like all of us to help it be even more welcoming, friendly, and inclusive. I think we all can help in achieving that.
New developers: don’t be shy, you can help too. Updating documentation of a new tool you are learning is a great start.
Maintainers: help us build a friendly ecosystem, it’s difficult for a new developer to come and try to help. Please be nice.

—————————————————————–

Here are a couple of others that you can answer if you want to, but if you don’t have the time, that’s ok:

How did your project, FastAPI, come about?

I had spent years finding the right tools and plug-ins (even testing other languages with their frameworks) to build APIs.
I wanted to have automatic docs; data validation, serialization, and documentation; I wanted it to use open standards like OpenAPI, JSON Schema, and OAuth2; I wanted it to be independent of other things, like database and ORM, etc.
I had somewhat achieved it with some components from several places, but it was difficult to use and somewhat brittle, as there were a lot of components and plug-ins, and I had to somehow make them interact well together.
I also discovered that having types as, in TypeScript, it was possible to have autocompletion and checks for many errors (type checks). But then Python added optional type hints! 🎉
And after searching everywhere for a framework that used them and did all that, and finding that it didn’t exist yet, I used all the great ideas brought by previous tools with some of mine to integrate all those features in a single package.
I also wanted to provide a development experience as pleasant as possible, with as small/simple code as possible, while having great performance (powered by the awesome tools underneath, Starlette and Pydantic).

What top three things did you learn while creating the package?

First, that it was possible. I thought building a package that others found useful was reserved for some olympian-semi-god coders. It turns out that if there’s something to solve, and you solve it, and you help others use it to solve the same thing, that’s all that is needed.
Second, I learned a lot about how Python interacts with the web. FastAPI uses the new standard ASGI (the spiritual successor to WSGI), I learned a lot of it. Especially reading the beautiful and clean code of Starlette.
Third, I learned a lot about how Python works underneath by adding features to Pydantic. To be able to provide all its awesome features and the great simplicity while using it, its own internal code has to be, naturally, very complex. I even learned about undocumented features of Python’s internal typing parsing, that are needed to make everything work.
But I don’t think that a new developer needs to learn the last 2 things, the first one is the most important one. And as I was able to build FastAPI using the great tools and ideas provided by others, I hope FastAPI can provide a simple and easy way for others to build their ideas.

Do you have any advice for other aspiring package creators?

Write docs for your package. It doesn’t exist completely if it’s not well documented. And write them from the point of view of a new user, not of your own.
Also, building and publishing a new package is now extremely easy. Use Flit or Poetry if your project is simple enough to use them (i.e. pure Python, you are not building with Cython extensions, etc).

The post PyDev of the Week: Sebastián Ramírez appeared first on The Mouse Vs. The Python.

Erik Marsja: How to Save a Seaborn Plot as a File (e.g., PNG, PDF, EPS, TIFF)

$
0
0

The post How to Save a Seaborn Plot as a File (e.g., PNG, PDF, EPS, TIFF) appeared first on Erik Marsja.

In this short post, we will learn how to save Seaborn plots to a range of different file formats. More specifically, we will learn how to use the plt.savefig method save plots made with Seaborn to:

  1. Portable Network Graphics (PNG)
  2. Portable Document Format (PDF)
  3. Encapsulated Postscript (EPS)
  4. Tagged Image File Format (TIFF)
  5. Scalable Vector Graphics (SVG)

First, we will create some basic plots and work with Matplotlibs savefig method to export the files to the different file formats. There is more information on data visualization in Python using Seaborn and Matplotlib in the following posts:

Prerequisites: Python and Seaborn

Now, before learning how to save Seaborn plots (e.g., to .png files), we need to have both Python and Seaborn installed. There are two easy methods to install Seaborn. First, if we don’t have Python installed we can download and install a Python distribution packed with Seaborn (e.g., Anaconda). Second, if we already have Python installed we can install Seaborn using Pip. Of course, there are a number of mandatory dependencies (i.e., NumPy, SciPy, Matplotlib, & Pandas) but pip will installed them too. At times, we may need to update Seaborn and we will after we have installed Seaborn, learn how to update Seaborn to the latest version.

How to Install Seaborn with Pip

Now we’re ready to use pip to install Seaborn. It’s very simple. First, we open up a terminal window, or Windows command prompt, and type pip -m install seaborn.

How to Upgrade Seaborn using Pip and Conda

In this section, before creating and saving a Seaborn plot we will learn how to upgrade Seaborn using pip and conda. First, if we want to upgrade Seaborn with pip we just type the following code: pip install -upgrade seaborn.

If we, on the other hand, have the Anaconda Python distribution installed we will use conda to update Seaborn. Now, this is also very easy and we will open up a terminal window (or the Anaconda Prompt, if we use Windows) and type conda update seaborn.

Learn more about installing, using, and upgrading Python packages using pip, pipx, and conda in the following two posts:

When we are installing and upgrading packages, we may notice, that we also need to upgrade pip.

Using the plt.savefig Method

In this section, before we start saving a Seaborn plot as a file, we are going to learn a bit more about the plt.savefig method.

Saving Seaborn plots to files using the plt.savefig methodThe savefig method

As can be seen in the image above, we have a number of arguments to work with.

In this post, we are going to work with some of them when saving Seaborn plots as a file (e.g., PDF). Specifically, we will use the fname, dpi, format, orientation, and transparent. Now, orientation can only be used in the format is postscript (e.g., eps). Thus, we will only use it when we are saving a Seaborn plot as a .eps file.

Concerning the other arguments, they will work with other formats as well but we will only use them when we save a Seaborn plot as a png file.

How to Save a Seaborn Plot as a File (i.e., png, eps, svg, pdf)

In this section, we are finally going to learn how to save a Seaborn plot. Now, in all the examples of saving Seaborn plots here we will start by creating a plot. First, we need to import Seaborn, matplotlib.pyplot, and Pandas. Here, we are following convention and import seaborn as sns, matplotlib.pyplot as plt, and pandas as pd. Note, we need to do this in all our Python scripts in which we are visualizing data and saving the plots to files.

import seaborn as sns
import matplotlib.pyplot as plt
import pandas as pd

Example Data

Next, we are going to import data to visualize. Here, we are using Pandas and the pd.read_csv method to load data from a CSV file.

data = 'https://vincentarelbundock.github.io/Rdatasets/csv/datasets/mtcars.csv'
df = pd.read_csv(data, index_col=0)
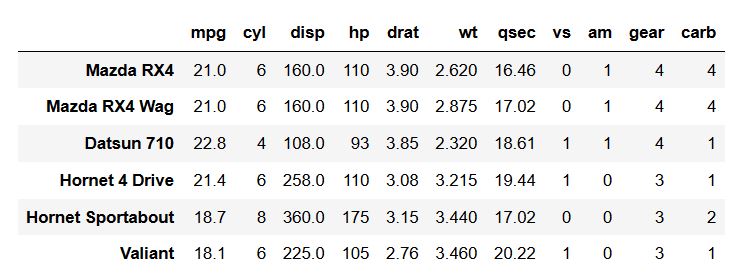
df.head(6)

How to Save a Seaborn Plot as png

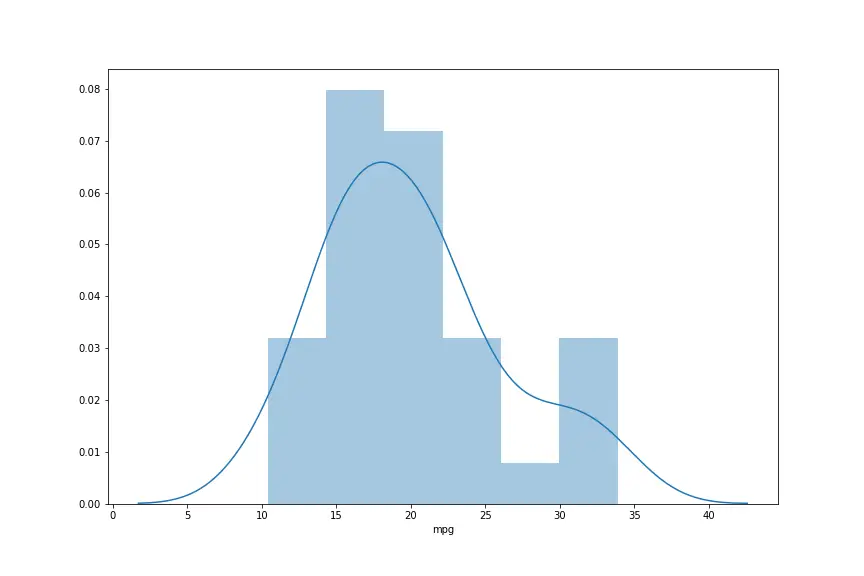
In the first example, we are going to export the Seaborn plot as Portable Network Graphics (png). First, we need to create our plot and we are going to create a simple histogram using sns.distplot.

In the second line of code, we are using plt.savefig with only the fname argument. Note, we are saving the file as a png only by using a string as fname. That is, we add the file ending .png to tell plt.savefig that we want the Seaborn plot saved as a png.

sns.distplot(df['mpg'])
plt.savefig('save_as_a_png.png')
Saving a Seaborn Histogram Plot as Png FileSaved PNG file (larger version)

Saving a High-Resolution PNG

Now, we will also use the dpi argument here. If we, for instance, wanted to save the histogram plot as a high-resolution image file. Most commonly is, however, that when we need a high-resolution image, we also want a different format. Anyway, if we want to save the histogram with 300 dpi, this is how we do it:

sns.distplot(df['mpg'])
plt.savefig('saving-a-high-resolution-seaborn-plot.png', dpi=300)

How to Save a Transparent PNG

In this example, we are going to save the Seaborn plot as a transparent png. That is, we will use the transparent argument and set it to true.

sns.distplot(df['mpg'])
plt.savefig('saving-a-seaborn-plot-as-png-file-transparent.png', 
           transparent=True)
How to Export a Seaborn Plot as PNGTransparent PNG

Save a Seaborn Figure as a PDF File

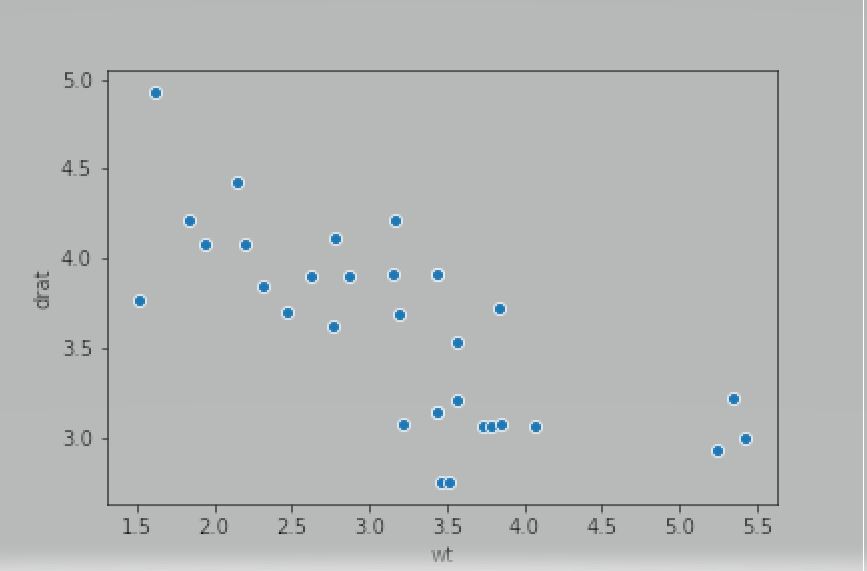
In this section, we are going to learn how to save a Seaborn plot as a .pdf file. As when we learned how to save a histogram figure as a png, we first need to make a plot. Here, we are going to create a scatter plot using the scatterplot method from Seaborn.

sns.scatterplot(x='wt', y='drat', data=df)
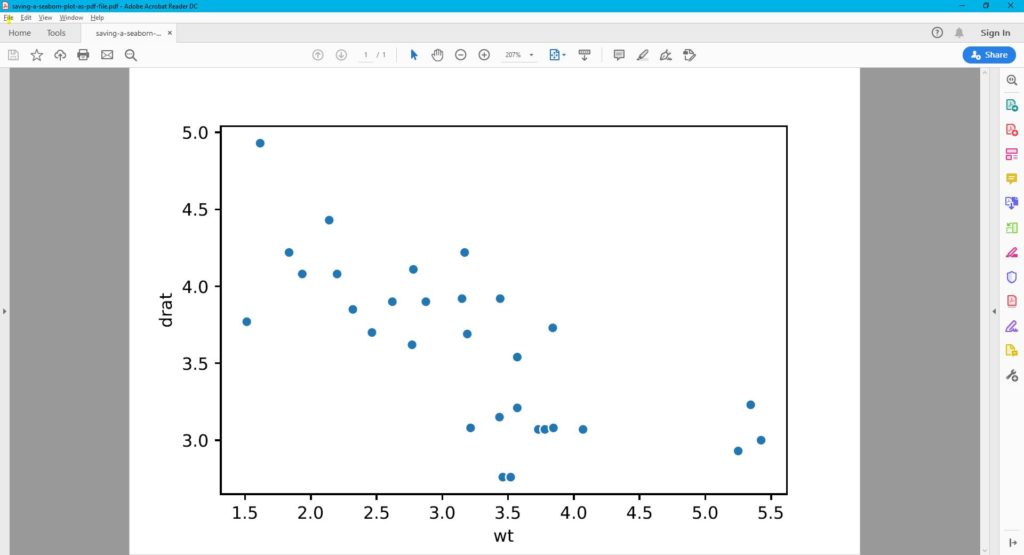
plt.savefig('saving-a-seaborn-plot-as-pdf-file.pdf')
How to Save a Seaborn Plot as a PDF filePDF file

Saving a Seaborn Plot as a High-Resolution PDF file

In this section, we are going to use the dpi argument again. Many scientific journals requires image files to be in high-resolution images. For example, the PLOS journals (e.g., Plos One) requires figures to be in 300 dpi. Here’s how to save a Seaborn plot as a PDF with 300 dpi:

<pre><code class="lang-py">sns.scatterplot(x='wt', y='drat', data=df)
plt.savefig('saving-a-seaborn-plot-as-pdf-file-300dpi.pdf', 
           dpi=300)</code></pre>

How to Save Python Data Visualizations (e.g., Seaborn plots) to an EPS file

In this section, we will carry on and learn how to save a Seaborn plot as an Encapsulated Postscript file. First, we will change the file ending (the fname argument) to .eps to export the plot as an EPS file. Second, we will learn how to save the Seaborn plot as a high-resolution .eps file.

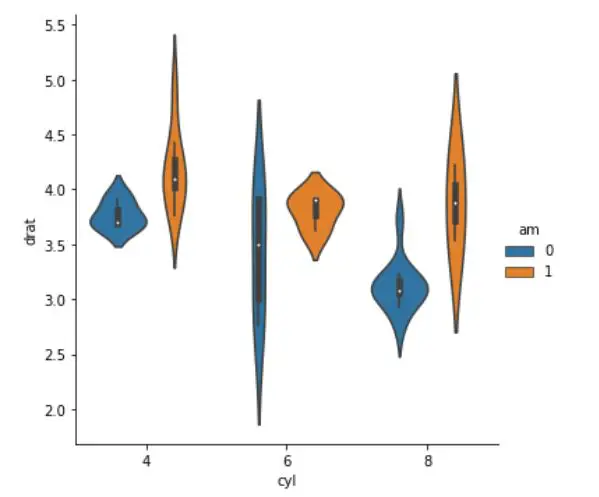
In this example, we are going to create a violin plot using Seaborn’s catplot method and save it as a file:

sns.catplot(x='cyl', y='drat', hue='am',
data=df, kind='violin')
plt.savefig('saving-a-seaborn-plot-as-eps-file.eps')
Saving a seaborn plot as a eps fileViolin plot to save to eps

Saving a Seaborn Plot as a High-resolution EPS file

Now, we are already familiar with how to set the dpi but in the next example we are going to save the Seaborn violin plot as a high-resolution image file:

sns.catplot(x='cyl', y='drat', hue='am',
                data=df, kind='violin')
plt.savefig('saving-a-seaborn-plot-as-eps-file-300dpi.eps',
           dpi=300)

Saving plots as EPS, and also TIFF (as we will learn about later) is also formats that are required, or recommended (e.g., see the American Psychological Associations recommendations in ther submission guidelines).

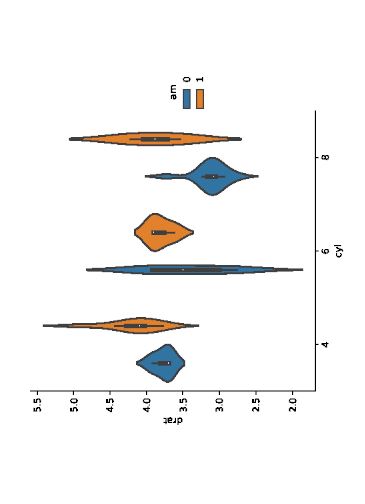
Saving the Seaborn Plot in Landscape (EPS)

Now, in the final saving a plot to EPS example, we are going to use the orientation argument to save the Seaborn plot in landscape.

sns.catplot(x='cyl', y='drat', hue='am',
                data=df, kind='violin')
plt.savefig('saving-a-seaborn-plot-as-eps-file-300dpi.eps', orientation="landscape",
           dpi=300)
How to Save a Seaborn plot as a fileSeaborn plot saved in landscape orientation

How to Save Seaborn plots to TIFF files

In this section, we will use the final format to save the Seaborn plots. More specifically, we will save the plots as in the Tagged Image File Format (TIFF). Now, as with the other formats, we will change the file ending (the fname argument) to .tiff. This, will as we now know, save the plot as a TIFF file.

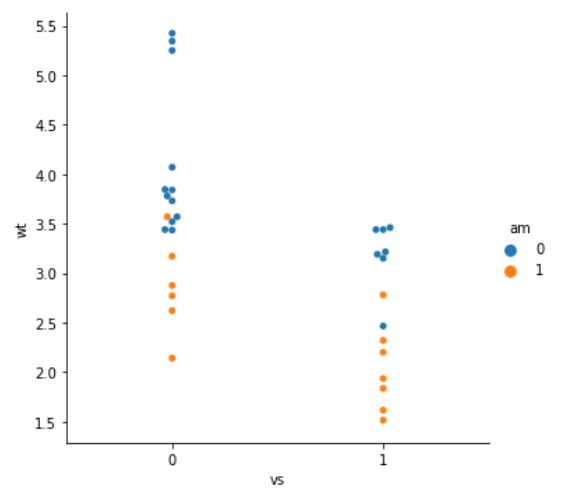
Learn how to save a swarm plot, created in seaborn, to a TIFF file.Swarm plot to save as TIFF

In the how to save to a TIFF file example, we are going to continue working with the catplot method but now we are going to create a swarm plot and save it as a TIFF file.

sns.catplot(x='vs', y='wt', hue='am',
                data=df, kind='swarm')
plt.savefig('saving-a-seaborn-plot-as-eps-file.tiff')

Saving a (Swarm) Plot as a High-Resolution TIFF File

In the final, how to save a TIFF file example, we are going to save the Seaborn plot as a high-resolution TIFF file. Why? Well, as previously mentioned a lot of scientific journals require, or recommend, that we use the PDF, EPS, or TIFF format when we submit our scientific papers.

Now, here’s how to explort the Seaborn plot as a TIFF file with high-resolution:

<pre><code class="lang-py">sns.catplot(x='vs', y='wt', hue='am',
                data=df, kind='swarm')
plt.savefig('saving-a-seaborn-plot-as-eps-file.tiff',
           dpi=300)</code></pre>

How to Save a Plot in Python Seaborn as a SVG File

In the final example, we are going to save a Seaborn plot as a SVG file. Now, we already know that we just change the file ending to accomplish this:

sns.catplot(x='vs', y='wt', hue='am',
                data=df, kind='swarm')
plt.savefig('saving-a-seaborn-plot-as-eps-file.svg')

Note, if we want to save the SVG file as a high-resolution SVG file, we’d just add the dpi=300 as we’ve learned in the previous examples.

There are, of course, a couple of other arguments that could’ve been used when working with plt.savefig. However, when working with Seaborn these are, most often, redundant. The formatting is already taken care of and we get quite nice-looking image files of our Seaborn plots.

Conclusion: Saving Plots in Python to Files

In this Python data visualization tutorial, we have learned how to save Python plots (made in Seaborn) as PNG, PDF, EPS, TIFF, and SVG files. It was quite simple, and we simply used the savefig method.

The post How to Save a Seaborn Plot as a File (e.g., PNG, PDF, EPS, TIFF) appeared first on Erik Marsja.

Chris Moffitt: Using Markdown to Create Responsive HTML Emails

$
0
0

Introduction

As part of managing the PB Python newsletter, I wanted to develop a simple way to write emails once using plain text and turn them into responsive HTML emails for the newsletter. In addition, I needed to maintain a static archive page on the blog that links to the content of each newsletter. This article shows how to use python tools to transform a markdown file into a responsive HTML email suitable for a newsletter as well as a standalone page integrated into a pelican blog.

Rationale

I am a firm believer in having access to all of the content I create in a simple text format. That is part of the reason why I use pelican for the blog and write all content in restructured text. I also believe in hosting the blog using static HTML so it is fast for readers and simple to distribute. Since I spend a lot of time creating content, I want to make sure I can easily transform it into another format if needed. Plain text files are the best format for my needs.

As I wrote in my previous post, Mailchimp was getting cost prohibitive. In addition, I did not like playing around with formatting emails. I want to focus on content and turning it into a clean and responsive email - not working with an online email editor. I also want the newsletter archives available for people to view and search in a more integrated way with the blog.

One thing that Mailchimp does well is that it provides an archive of emails and ability for the owner to download them in raw text. However, once you cancel your account, those archives will go away. It’s also not very search engine friendly so it’s hard to reference back to it and expose the content to others not subscribed to the newsletter.

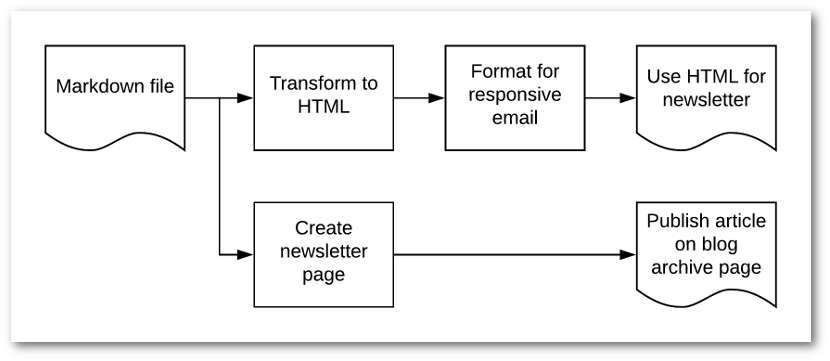
With all that in mind, here is the high level process I had in mind:

Markdown email flow

HTML Email

Before I go through the python scripts, here’s some background on developing responsive HTML-based emails. Unfortunately, building a template that works well in all email clients is not easy. I naively assumed that the tips and tricks that work for a web site would work in an HTML email. Unfortunately that is not the case. The best information I could find is that you need to use HTML tables to format messages so they will look acceptable in all the email clients. Yuck. I feel like I’m back in Geocities.

Geocities

This is one of the benefits that email vendors like Mailchimp provide. They will go through all the hard work of figuring out how to make templates that look good everywhere. For some this makes complete sense. For my simple needs, it was overkill. Your mileage may vary.

Along the way, I found several resources that I leveraged for portions of my final solution. Here they are for reference:

Besides having to use HTML tables, I learned that it is recommended that all the CSS be inlined in the email. In other words, the email needs to have all the styling included in the tags using style :

<h2style='color:#337ab7; font-family:"Fjalla One", sans-serif; font-weight:500; margin:0; font-size:125%'>
    Other news
</h2>

Once again this is very old school web and would be really painful if not for tools that will do the inlining for you. I used the excellent premailer library to take an embedded CSS stylesheet and inline with the rest of the HTML.

You can find a full HTML template and all the code on github but here is a simple summary for reference. Please use the github version since this one is severely simplified and likely won’t work as is:

<!DOCTYPE HTML PUBLIC "-//W3C//DTD HTML 4.01 Transitional//EN""http://www.w3.org/TR/html4/loose.dtd"><htmllang="en"><head><metahttp-equiv="Content-Type"content="text/html; charset=UTF-8"><metaname="viewport"content="width=device-width, initial-scale=1"><metahttp-equiv="X-UA-Compatible"content="IE=edge"><title>{{title}}</title><styletype="text/css">body{margin:0!important;padding:0!important;width:100%!important;color:#333;font-family:'Average Sans',sans-serif;font-size:14px;}</style></head><body><center><divstyle="background-color:#F2F2F2; max-width: 640px; margin: auto;"><tablewidth="640"cellspacing="0"cellpadding="0"border="0"align="center"style="max-width:640px; width:100%;"bgcolor="#FFFFFF"><tr><tdalign="center"valign="top"style="padding:10px;"><tablewidth="600"cellspacing="0"cellpadding="0"border="0"align="center"style="max-width:600px; width:100%;"><tr><tdalign="left"valign="top"style="padding:10px;">
                {{email_content}}
                </td></tr></table></div><pstyle="border-top: 1px solid #c6c6c6; color: #a9a9a9; margin-top: 50px; padding-top: 20px;font-size:13px; margin-bottom: 13px;">
    You received this email because you subscribed to our list.
        You can  <ahref="{{UnsubscribeURL}}"style="color:#a9a9a9;"target="_blank"data-premailer="ignore">unsubscribe</a> at any time.</p><pstyle="color: #a9a9a9;margin-bottom: 13px;font-size:13px;">{{SenderInfoLine}}</p></center></body></html>

This is a jinja template and you will notice that there is a place for email_content and title . The next step in the process is to render a markdown text file into HTML and place that HTML snippet into a template.

Markdown Article

Now that we know how we want the HTML to look, let’s create a markdown file. The only twist with this solution is that I want to create one markdown file that can be rendered in pelican and used for the HTML email.

Here is what a simple markdown file( sample_doc.md ) looks like that will work with pelican:

Title: Newsletter Number 6
Date: 12-9-2019 10:04am
Template: newsletter
URL: newsletter/issue-6.html
save_as: newsletter/issue-6.html

Welcome to the 6th edition of this newsletter.

## Around the site

* [Combining Multiple Excel Worksheets Into a Single Pandas Dataframe](https://pbpython.com/pandas-excel-tabs.html)
covers a simple approach to parse multiple excel tabs into one DataFrame.

## Other news

* [Altair](https://altair-viz.github.io/index.html) just released a new version. If you haven't looked at it in a while,
check out some of the [examples](https://altair-viz.github.io/gallery/index.html) for a snapshot of what you can do with it.

## Final Words

Thanks again for subscribing to the newsletter. Feel free to forward it on to others that may be interested.

The required input file uses standard markdown. The one tricky aspect is that the top 5 lines contain meta-data that pelican needs to make sure the correct url and templates are used when creating the output. Our final script will need to remove them so that it does not get rendered into the newsletter email. If you are not trying to incorporate into your blog, you can remove these lines.

If you are interested in incorporating this in your pelican blog, here is how my content is structured:

content
├── articles
├── extras
├── images
├── news
├── newsletter
│   ├── number_1.md
│   ├── number_2.md
│   ├── number_3.md
│   ├── number_4.md
│   ├── number_5.md
│   └── number_6.md
└── pages

All of the newsletter markdown files are stored in the newsletter directory and the blog posts are stored in the articles directory.

The final configuration I had to make in the pelicanconf.py file was to make sure the paths were setup correctly:

PATH='content'PAGE_PATHS=['newsletter','pages','news']

Now the blog is properly configured to render one of the newsletters.

Python code

Now that we have HTML template and the markdown document, we need a short python script to pull it all together. I will be using the following libraries so make sure they are all installed:

Additionally, make sure you are using python3 so you have access to pathlib and argparse .

In order to keep the article compact, I am only including the key components. Please look at the github repo for an approach that is a proper python standalone program that can take arguments from the command line.

The first step, import everything:

frommarkdown2importMarkdownfrompathlibimportPathfromjinja2importEnvironment,FileSystemLoaderfrompremailerimporttransformfromargparseimportArgumentParserfrombs4importBeautifulSoup

Setup the input files and output HTML file:

in_doc=Path.cwd()/'sample_doc.md'template_file='template.html'out_file=Path.cwd()/f'{in_doc.stem}_email.html'

Please refer to the pathlib article if you are not familiar with how or why to use it.

Now that the files are established, we need to read in the markdown file and parse out the header meta-data:

withopen(in_doc)asf:all_content=f.readlines()

Using readlines to read the file ensures that each line in the file is stored in a list. This approach works for our small file but could be problematic if you had a massive file that you did not want to read into memory at once. For an email newsletter you should be ok with using readlines .

Here is what it all_content[0:6] looks like:

['Title: Newsletter Number 6\n','Date: 12-9-2019 10:04am\n','Template: newsletter\n','URL: newsletter/issue-6.html\n','save_as: newsletter/issue-6.html\n','\n']

We can clean up the title line for insertion into the template:

title_line=all_content[0]title=f'PB Python - {title_line[7:].strip()}'

Which renders a title PB Python - Newsletter Number 6

The final parsing step is to get the body into a single list without the header:

body_content=all_content[6:]

Convert the raw markdown into a simple HTML string:

markdowner=Markdown()markdown_content=markdowner.convert(''.join(body_content))

Now that the HTML is ready, we need to insert it into our jinja template:

# Set up jinja templatesenv=Environment(loader=FileSystemLoader('.'))template=env.get_template(template_file)template_vars={'email_content':markdown_content,'title':title}raw_html=template.render(template_vars)

At this point, raw_html has a fully formed HTML version of the newsletter. We need to use premailer’s transform to get the CSS inlined. I am also using BeautifulSoup to do some cleaning up and formatting of the HTML. This is purely aesthetic but I think it’s simple enough to do so I am including it:

soup=BeautifulSoup(transform(raw_html),'html.parser').prettify(formatter="html")

The final step is to make sure that the unsubscribe link does not get mangled. Depending on your email provider, you may not need to do this:

final_HTML=str(soup).replace('%7B%7BUnsubscribeURL%7D%7D','{{UnsubscribeURL}}')out_file.write_text(final_HTML)

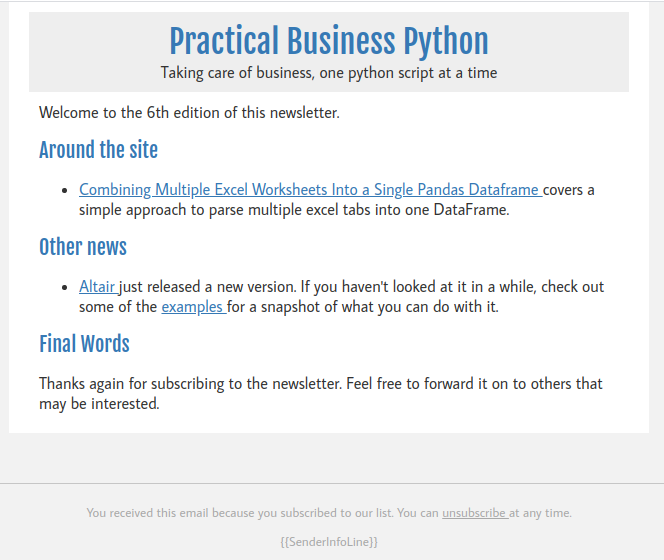
Here is an example of the final email file:

Final newsletter

You should be able to copy and paste the raw HTML into your email marketing campaign and be good to go. In addition, this file will render properly in pelican. See this page for some past examples.

Summary

Markdown is a simple text format that can be parsed and turned into HTML using various python tools. In this case, the markdown file can be combined with a responsive HTML email template to simplify the process of generating content for newsletters. The added bonus is that the content can be included in a static blog so that it is searchable and easily available to your readers.

This solution is not limited to just building emails. Now that newer versions of pandas will include a native to_markdown method, this general approach could be extended to other uses. Using these principles you can build fairly robust reports and documents using markdown then incorporate the dataframe output into the final results. If there is interest in an example, let me know in the comments.

IslandT: Python class to create SQL database, table and submit values

$
0
0

Let us continue with the final touch up of the python class uses to create SQL database and submits values to the SQL database’s earning table.

What we have modified from the previous Input class.

  • The main program will only call the Input class once to create the SQL database and the earning table if they have not been created yet!
  • We will pass the action button into the Input class and disable the action button if there is an ongoing committing job.
  • The main program will pass the description and earning into the submit method of the Input class.

Below is the final revised version for both the main program and the Input class.

import tkinter as tk
from tkinter import ttk

from Input import Input

win = tk.Tk()

win.title("Earning Input")

def submit():
    if(description.get()!='' and earning.get()!=""):
        sub_mit.submit(description.get(), earning.get())
    else:
        print("You need to enter a value!")

#create label frame for ui
earn= ttk.Labelframe(win, text = "Daily Earning Input")
earn.grid(column=0, row=0, padx=4, pady=4)
# create label for description
dLabel = ttk.Label(earn, text="Description:").grid(column=0, row=0)
# create text box for description
description = tk.StringVar()
descriptionEntry = ttk.Entry(earn, width=13, textvariable=description)
descriptionEntry.grid(column=1, row=0)

# create label for earning
eLabel = ttk.Label(earn, text="Earning:").grid(column=2, row=0)
# create text box for earning
earning = tk.StringVar()
earningEntry = ttk.Entry(earn, width=13, textvariable=earning)
earningEntry.grid(column=3, row=0)
# create the action button
action = ttk.Button(earn, text="submit", command=submit)
action.grid(column=5, row=0)

win.resizable(0,0)

sub_mit = Input(action)
sub_mit.setting()

win.mainloop()
import sqlite3

class Input:
    def __init__(self, action):
        self.action = action

    def setting(self):
        self.action["state"] = "disabled"
        conn = sqlite3.connect('daily_earning.db')
        print("Opened database successfully")
        try:
            conn.execute('''CREATE TABLE DAILY_EARNING_CHART
                 (ID INTEGER PRIMARY KEY AUTOINCREMENT,
                 DESCRIPTION    TEXT (50)   NOT NULL,
                 EARNING    TEXT  NOT NULL,
                 TIME   TEXT NOT NULL);''')
        except:
            pass

        self.action["state"] = "enable"

        conn.close()

    def submit(self,description, earning): # Insert values into earning table
        self.action["state"] = "disabled"
        self.description = description
        self.earning = earning
        try:
            sqliteConnection = sqlite3.connect('daily_earning.db')
            cursor = sqliteConnection.cursor()
            print("Successfully Connected to SQLite")

            sqlite_insert_query = "INSERT INTO DAILY_EARNING_CHART (DESCRIPTION,EARNING,TIME) VALUES ('" + self.description + "','"+ self.earning + "',datetime('now', 'localtime'))"

            count = cursor.execute(sqlite_insert_query)
            sqliteConnection.commit()
            print("Record inserted successfully into DAILY_EARNING_CHART table", cursor.rowcount)
            cursor.close()

        except sqlite3.Error as error:
            print("Failed to insert earning data into sqlite table", error)
        finally:
            if (sqliteConnection):
                sqliteConnection.close()
            self.action["state"] = "enable"

The python program works alright!

More shoes have been sold!

That is all, in the next chapter we will include more features into the above python class file!

Viewing all 22405 articles
Browse latest View live


<script src="https://jsc.adskeeper.com/r/s/rssing.com.1596347.js" async> </script>