As everyone knows a lot of subreddits are opinionated, so I thought that it might be interesting to measure the opinion of different subreddits opinions. Not trying to start a holy war I’ve specifically decided to ignore r/worldnews and similar subreddits, and chose a semi-random topic – “Apu reportedly being written out of The Simpsons”.
For accessing Reddit API I’ve decided to use praw, because it already implements all OAuth related stuff and almost the same as REST API.
As a first step I’ve found all posts with that URL and populated pandas DataFrame:
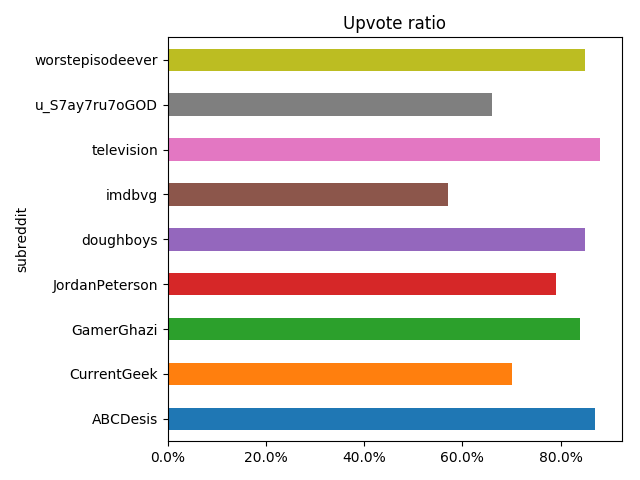
[*posts]=reddit.subreddit('all').search(f"url:{url}",limit=1000)posts_df=pd.DataFrame([(post.id,post.subreddit.display_name,post.title,post.score,datetime.utcfromtimestamp(post.created_utc),post.url,post.num_comments,post.upvote_ratio)forpostinposts],columns=['id','subreddit','title','score','created','url','num_comments','upvote_ratio'])posts_df.head()idsubreddittitlescorecreatedurlnum_commentsupvote_ratio09rmz0otelevisionAputobewrittenoutofTheSimpsons14552018-10-2617:49:00https://www.indiewire.com/2018/10/simpsons-drop-apu-character-adi-shankar-12...18020.8819rnu73GamerGhaziApureportedlybeingwrittenoutofTheSimpsons732018-10-2619:30:39https://www.indiewire.com/2018/10/simpsons-drop-apu-character-adi-shankar-12...950.8329roen1worstepisodeeverTheSimpsonsWritingOutApu142018-10-2620:38:21https://www.indiewire.com/2018/10/simpsons-drop-apu-character-adi-shankar-12...220.9439rq7ovABCDesis‘TheSimpsons’IsEliminatingApu,ButProducerAdiShankarFoundthePerfec...262018-10-2700:40:28https://www.indiewire.com/2018/10/simpsons-drop-apu-character-adi-shankar-12...110.8449rnd6ydoughboysAputobewrittenoutofTheSimpsons242018-10-2618:34:58https://www.indiewire.com/2018/10/simpsons-drop-apu-character-adi-shankar-12...90.87The easiest metric for opinion is upvote ratio:
posts_df[['subreddit','upvote_ratio']] \
    .groupby('subreddit') \
    .mean()['upvote_ratio'] \
    .reset_index() \
    .plot(kind='barh',x='subreddit',y='upvote_ratio',title='Upvote ratio',legend=False) \
    .xaxis \
    .set_major_formatter(FuncFormatter(lambdax,_:'{:.1f}%'.format(x*100)))
But it doesn’t say us anything:
The most straightforward metric to measure is score:
posts_df[['subreddit','score']] \
    .groupby('subreddit') \
    .sum()['score'] \
    .reset_index() \
    .plot(kind='barh',x='subreddit',y='score',title='Score',legend=False)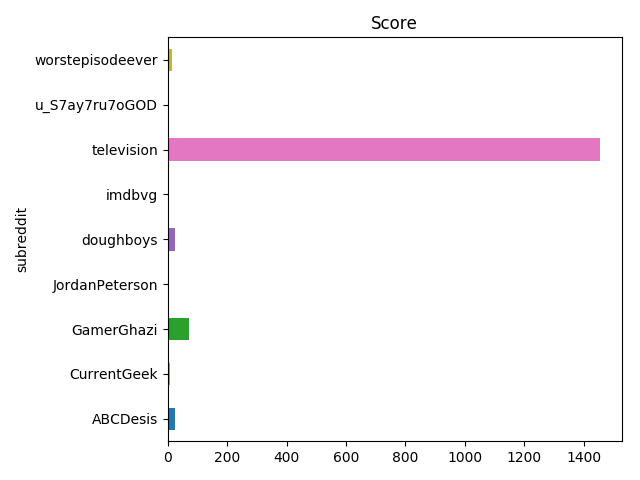
A second obvious metric is a number of comments:
posts_df[['subreddit','num_comments']] \
    .groupby('subreddit') \
    .sum()['num_comments'] \
    .reset_index() \
    .plot(kind='barh',x='subreddit',y='num_comments',title='Number of comments',legend=False)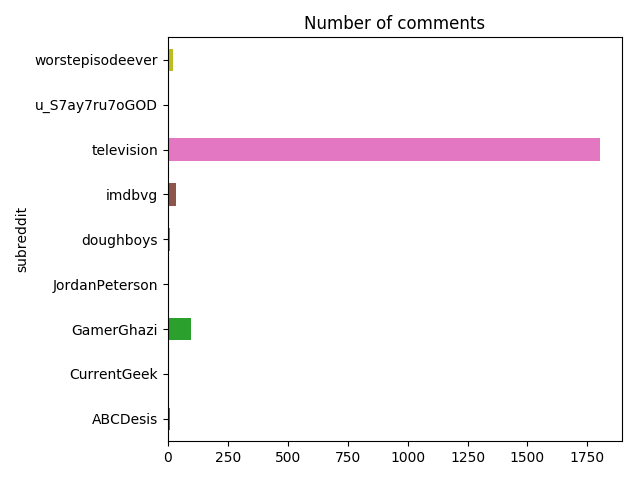
As absolute numbers can’t say us anything about an opinion of a subbreddit, I’ve decided to calculate normalized score and number of comments with data from the last 1000 of posts from the subreddit:
defnormalize(post):[*subreddit_posts]=reddit.subreddit(post.subreddit.display_name).new(limit=1000)subreddit_posts_df=pd.DataFrame([(post.id,post.score,post.num_comments)forpostinsubreddit_posts],columns=('id','score','num_comments'))norm_score=((post.score-subreddit_posts_df.score.mean())/(subreddit_posts_df.score.max()-subreddit_posts_df.score.min()))norm_num_comments=((post.num_comments-subreddit_posts_df.num_comments.mean())/(subreddit_posts_df.num_comments.max()-subreddit_posts_df.num_comments.min()))returnnorm_score,norm_num_commentsnormalized_vals=pd \
    .DataFrame([normalize(post)forpostinposts],columns=['norm_score','norm_num_comments']) \
    .fillna(0)posts_df[['norm_score','norm_num_comments']]=normalized_vals
And look at the popularity of the link based on the numbers:
posts_df[['subreddit','norm_score','norm_num_comments']] \
    .groupby('subreddit') \
    .sum()[['norm_score','norm_num_comments']] \
    .reset_index() \
    .rename(columns={'norm_score':'Normalized score','norm_num_comments':'Normalized number of comments'}) \
    .plot(kind='barh',x='subreddit',title='Normalized popularity')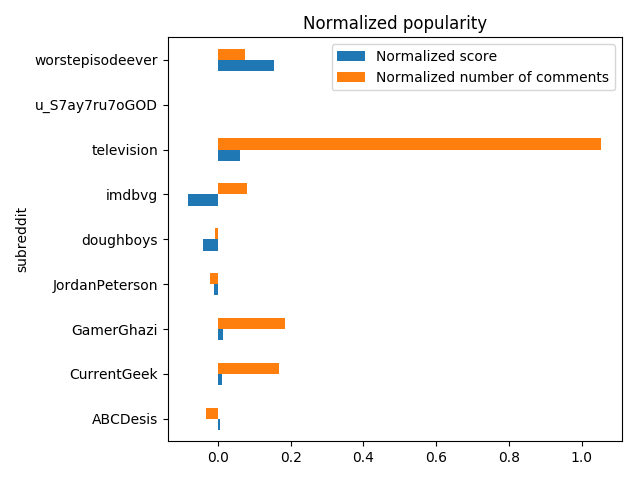
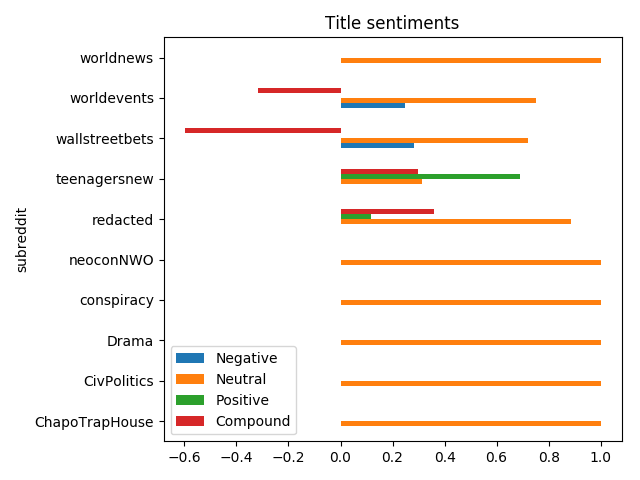
As in different subreddits a link can be shared with a different title with totally different sentiments, it seemed interesting to do sentiment analysis on titles:
sid=SentimentIntensityAnalyzer()posts_sentiments=posts_df.title.apply(sid.polarity_scores).apply(pd.Series)posts_df=posts_df.assign(title_neg=posts_sentiments.neg,title_neu=posts_sentiments.neu,title_pos=posts_sentiments.pos,title_compound=posts_sentiments['compound'])And notice that people are using the same title almost every time:
posts_df[['subreddit','title_neg','title_neu','title_pos','title_compound']] \
    .groupby('subreddit') \
    .sum()[['title_neg','title_neu','title_pos','title_compound']] \
    .reset_index() \
    .rename(columns={'title_neg':'Title negativity','title_pos':'Title positivity','title_neu':'Title neutrality','title_compound':'Title sentiment'}) \
    .plot(kind='barh',x='subreddit',title='Title sentiments',legend=True)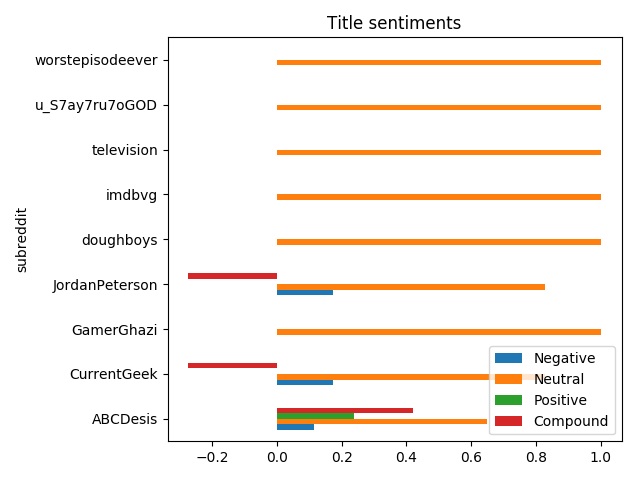
Sentiments of a title isn’t that interesting, but it might be much
more interesting for comments. I’ve decided to only handle root
comments as replies to comments might be totally not related to
post subject, and they’re making everything more complicated.
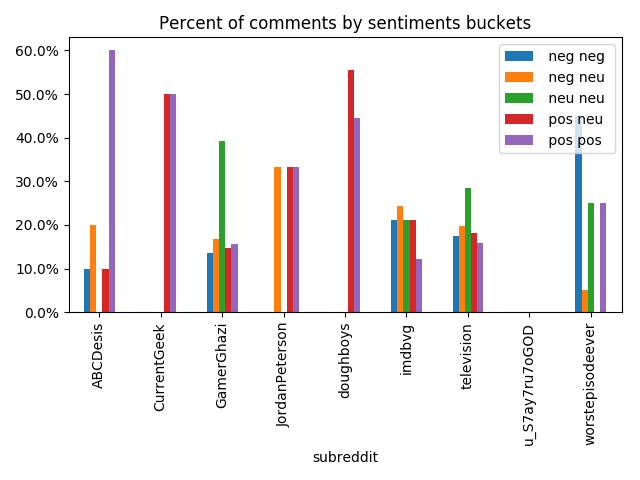
For comments analysis I’ve bucketed them to five buckets by
compound value, and calculated mean normalized score and percentage:
posts_comments_df=pd \
    .concat([handle_post_comments(post)forpostinposts]) \  # handle_post_comments is huge and available in the gist.fillna(0)>>>posts_comments_df.head()keyroot_comments_keyroot_comments_neg_neg_amountroot_comments_neg_neg_norm_scoreroot_comments_neg_neg_percentroot_comments_neg_neu_amountroot_comments_neg_neu_norm_scoreroot_comments_neg_neu_percentroot_comments_neu_neu_amountroot_comments_neu_neu_norm_scoreroot_comments_neu_neu_percentroot_comments_pos_neu_amountroot_comments_pos_neu_norm_scoreroot_comments_pos_neu_percentroot_comments_pos_pos_amountroot_comments_pos_pos_norm_scoreroot_comments_pos_pos_percentroot_comments_post_id09rmz0o087.0-0.0051390.17575898.00.0192010.197980141.0-0.0071250.28484890.0-0.0100920.181818790.0060540.1595969rmz0o09rnu73012.00.0481720.13483115.0-0.0613310.16853935.0-0.0105380.39325813.0-0.0157620.146067140.0654020.1573039rnu7309roen109.0-0.0949210.4500001.00.0257140.0500005.00.0485710.2500000.00.0000000.00000050.1171430.2500009roen109rq7ov01.00.4764710.1000002.0-0.5235290.2000000.00.0000000.0000001.0-0.2294120.10000060.1333330.6000009rq7ov09rnd6y00.00.0000000.0000000.00.0000000.0000000.00.0000000.0000005.0-0.0277780.55555640.0347220.4444449rnd6y
So now we can get a percent of comments by sentiments buckets:
percent_columns=['root_comments_neg_neg_percent','root_comments_neg_neu_percent','root_comments_neu_neu_percent','root_comments_pos_neu_percent','root_comments_pos_pos_percent']posts_with_comments_df[['subreddit']+percent_columns] \
    .groupby('subreddit') \
    .mean()[percent_columns] \
    .reset_index() \
    .rename(columns={column:column[13:-7].replace('_',' ')forcolumninpercent_columns}) \
    .plot(kind='bar',x='subreddit',legend=True,title='Percent of comments by sentiments buckets') \
    .yaxis \
    .set_major_formatter(FuncFormatter(lambday,_:'{:.1f}%'.format(y*100)))
It’s easy to spot that on less popular subreddits comments are more opinionated:
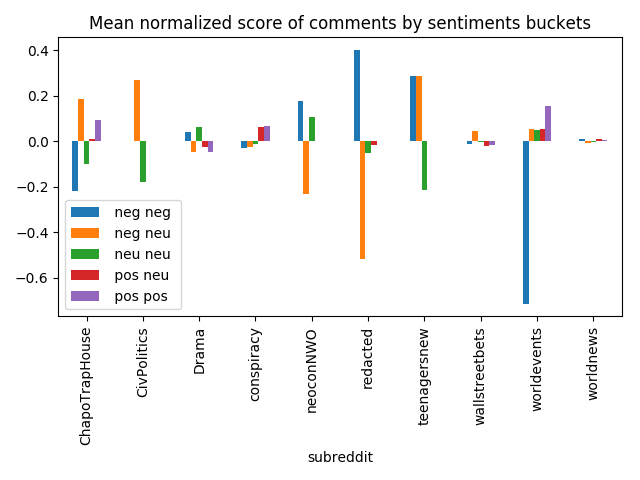
The same can be spotted with mean normalized scores:
norm_score_columns=['root_comments_neg_neg_norm_score','root_comments_neg_neu_norm_score','root_comments_neu_neu_norm_score','root_comments_pos_neu_norm_score','root_comments_pos_pos_norm_score']posts_with_comments_df[['subreddit']+norm_score_columns] \
    .groupby('subreddit') \
    .mean()[norm_score_columns] \
    .reset_index() \
    .rename(columns={column:column[13:-10].replace('_',' ')forcolumninnorm_score_columns}) \
    .plot(kind='bar',x='subreddit',legend=True,title='Mean normalized score of comments by sentiments buckets')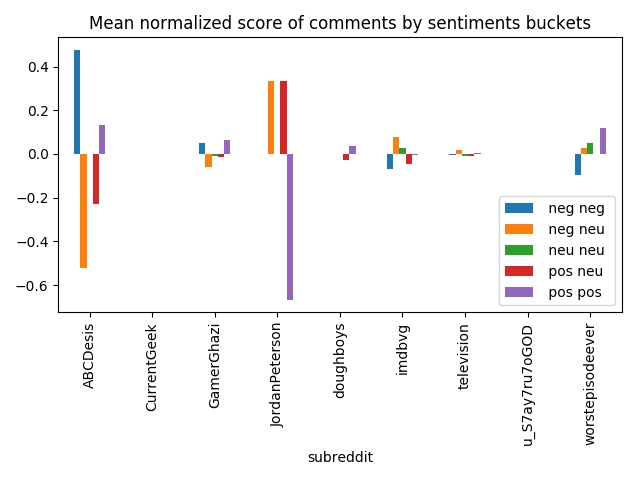
Although those plots are fun even with that link, it’s more fun with something more controversial. I’ve picked one of the recent posts from r/worldnews, and it’s easy to notice that different subreddits present the news in a different way:
And comments are rated differently, some subreddits are more neutral, some definitely not: