Disclaimer: If you have some bias and/or dislike AsyncIO, please read my previous blog post before starting a war.
Warning: Since I've published this article, my first benchmark published in public, I've received a lot of remarks. Even I've tried to have no errors to be the closest to the "truth", for this benchmark, I've made a mistake: No keepalive for Flask and Django. It's why I've made a second benchmark, and now API-Hour is participating to FrameworkBenchmarks contest, to have the most realistics numbers about theses problematics.
Thanks everybody that helped me to give me all pieces of information to improve my knowledge.
Please to forgive me, first times are always catastrophics, especially in public ;-)
For those who didn't follow AsyncIO news, aiohttp.web is a light Web framework based on aiohttp. It's like Flask but with less internal layers.
aiohttp is the implementation of HTTP with AsyncIO.
Moreover, API-Hour helps you to have multiprocess daemons with AsyncIO.
With this tool, we can compare Flask, Django and aiohttp.web in the same conditions.
This benchmark is based on a concrete need of one of our customers: they wanted to have a REST/JSON API to interact with their telephony server, based on Asterisk.
One of the WebServices gives the list of agents with their status. This WebService is heavily used because they use it on their public Website (itself having a serious traffic) to show who is available.
First, I've made a HTTP daemon based on Flask and Gunicorn, which gave honorable results. Later on, I replaced the HTTP part and pushed in production a daemon based on aiohttp.web and API-Hour.
A subset of theses daemons are used for this benchmark.
I've added a Django version because with Django and Flask, I certainly cover 90% of tools used by Python Web developers.
I've tried to have the same parameters for each daemon: for example, I obviously use the same number of workers, 16 in this benchmark.
I don't benchmark Django manage.py or dev HTTP server of Flask, I use Gunicorn, as most people use on production, to try to compare apples with apples.
On Server:
On Client:
System configuration
It's important to configure your PostgreSQL as a production server.
You need also to configure your Linux kernel to handle a lot of open sockets and some TCP tricks.
Everything is in the benchmark repository.
For now, I use wrk and wrk2 to benchmark.
wrk hits as fast as possible, where wrk2 hits with the same rate.
Each daemon has at least two WebServices:
On Django daemon, I added /agents_with_orm endpoint, to measure the overhead to use Django-ORM instead of to use SQL directly. Warning: I didn't find a solution to have the exact same query.
Between each run, the daemon is restarted to be sure that previous test doesn't pollute the next one.
Warning ! This benchmark doesn't represent the reality you can have in production, because you don't have a network limitation nor latency, it's only for calibration.
To simplify the reading, I summarize the captured values with an array and graphs:
On high charge, Django doesn't have the same behaviour as Flask: Both handle more or less the same requests rate, but Django penalizes less global latency of HTTP queries. The drawback is that the slow HTTP queries are very slow (26,43s for Django compared to 13,31s for Flask).
I removed Django ORM test for the next round because it isn't exactly the same SQL query generated and the performance difference with a SQL query is negligible.
I removed also Flask DB connection pool because the error rate is too important compared to other tests.
A longer run time is very important because of how resources availability can change with time.
There are at least two reasons for this:
1. Your test environment runs on top of some OS which continues its activity during the test.
Therefore, you need a long time to be more insensitive to transient use of your test machine resources by other things
like another OS daemon or cron job triggering meanwhile.
2. The ramp-up of your test will gradually consume more resources at different levels: at the level of your Python scripts & libs,
as well as at the level of you OS / (Virtual) Machine.
This decrease of available resources will not necessarily be instantaneous, nor linear.
This is a typical source of after-deployment bad surprises in prod.
Here too, to be as close as possible to production scenario, you need to give time to your test to arrive to a "hover", eventually saturating some resources.
Ideally you'd saturate the network first (which in this case is like winning the jackpot).
Here, I'm testing at a constant 4000 queries per second, this time through the network.
Warning: Since I've published this article, my first benchmark published in public, I've received a lot of remarks. Even I've tried to have no errors to be the closest to the "truth", for this benchmark, I've made a mistake: No keepalive for Flask and Django. It's why I've made a second benchmark, and now API-Hour is participating to FrameworkBenchmarks contest, to have the most realistics numbers about theses problematics.
Thanks everybody that helped me to give me all pieces of information to improve my knowledge.
Please to forgive me, first times are always catastrophics, especially in public ;-)
Context of this macro-benchmark
Today, I propose you to benchmark a HTTP daemon based on AsyncIO, and compare results with a Flask and Django version.For those who didn't follow AsyncIO news, aiohttp.web is a light Web framework based on aiohttp. It's like Flask but with less internal layers.
aiohttp is the implementation of HTTP with AsyncIO.
Moreover, API-Hour helps you to have multiprocess daemons with AsyncIO.
With this tool, we can compare Flask, Django and aiohttp.web in the same conditions.
This benchmark is based on a concrete need of one of our customers: they wanted to have a REST/JSON API to interact with their telephony server, based on Asterisk.
One of the WebServices gives the list of agents with their status. This WebService is heavily used because they use it on their public Website (itself having a serious traffic) to show who is available.
First, I've made a HTTP daemon based on Flask and Gunicorn, which gave honorable results. Later on, I replaced the HTTP part and pushed in production a daemon based on aiohttp.web and API-Hour.
A subset of theses daemons are used for this benchmark.
I've added a Django version because with Django and Flask, I certainly cover 90% of tools used by Python Web developers.
I've tried to have the same parameters for each daemon: for example, I obviously use the same number of workers, 16 in this benchmark.
I don't benchmark Django manage.py or dev HTTP server of Flask, I use Gunicorn, as most people use on production, to try to compare apples with apples.
Hardware
- Server: A Dell Precision M6800 with i7 2.90GHz and 16 GB of RAM
- Client: A Dell XPS L502X with i5 2.40GHz and 6GB of RAM
- Network: RJ45 cable between server and client
Network benchmark
I've almost 1Gb/s with this network:On Server:
$ iperf -c 192.168.2.101 -d
------------------------------------------------------------
Server listening on TCP port 5001
TCP window size: 28.6 MByte (default)
------------------------------------------------------------
------------------------------------------------------------
Client connecting to 192.168.2.101, TCP port 5001
TCP window size: 28.6 MByte (default)
------------------------------------------------------------
[  5] local 192.168.2.100 port 24831 connected with 192.168.2.101 port 5001
[  4] local 192.168.2.100 port 5001 connected with 192.168.2.101 port 16316
[ ID] Interval       Transfer     Bandwidth
[  4]  0.0-10.1 sec  1.06 GBytes   903 Mbits/sec
[  5]  0.0-10.1 sec  1.11 GBytes   943 Mbits/sec
On Client:
$ iperf -s
------------------------------------------------------------
Server listening on TCP port 5001
TCP window size: 28.6 MByte (default)
------------------------------------------------------------
[  4] local 192.168.2.101 port 5001 connected with 192.168.2.100 port 24831
------------------------------------------------------------
Client connecting to 192.168.2.100, TCP port 5001
TCP window size: 28.6 MByte (default)
------------------------------------------------------------
[  6] local 192.168.2.101 port 16316 connected with 192.168.2.100 port 5001
[ ID] Interval       Transfer     Bandwidth
[  6]  0.0-10.0 sec  1.06 GBytes   908 Mbits/sec
[  4]  0.0-10.2 sec  1.11 GBytes   927 Mbits/sec
System configuration
It's important to configure your PostgreSQL as a production server.
You need also to configure your Linux kernel to handle a lot of open sockets and some TCP tricks.
Everything is in the benchmark repository.
Client benchmark tool
From my experience with AsyncIO, Apache Benchmark (ab), Siege, Funkload and some old fashion HTTP benchmarks tools don't hit enough for an API-Hour daemon.For now, I use wrk and wrk2 to benchmark.
wrk hits as fast as possible, where wrk2 hits with the same rate.
Metrics observed
I record three metrics:- Requests/sec: Least interesting of metrics. (see below)
- Error rate: Sum of all errors (socket timeout, socket read/write, 5XX errors...)
- Reactivity: Certainly the most interesting of the three, it measures the time that our client will actually wait.
WebServices daemons
You can find all source code in API-Hour repository: https://github.com/Eyepea/API-Hour/tree/master/benchmarksEach daemon has at least two WebServices:
- /index: It's a simple JSON document
- /agents: The list of agents that uses, in backend, a SQL query to retrieve agents and status
On Django daemon, I added /agents_with_orm endpoint, to measure the overhead to use Django-ORM instead of to use SQL directly. Warning: I didn't find a solution to have the exact same query.
Methodology
Each daemon will run alone to preserve resources.Between each run, the daemon is restarted to be sure that previous test doesn't pollute the next one.
First turn
At the beginning, to have an idea how much maximum HTTP queries each daemon can support, I quickly attack (30 seconds) on localhost.Warning ! This benchmark doesn't represent the reality you can have in production, because you don't have a network limitation nor latency, it's only for calibration.
Simple JSON document
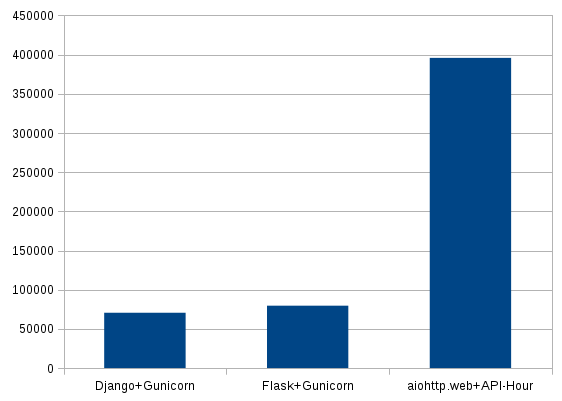
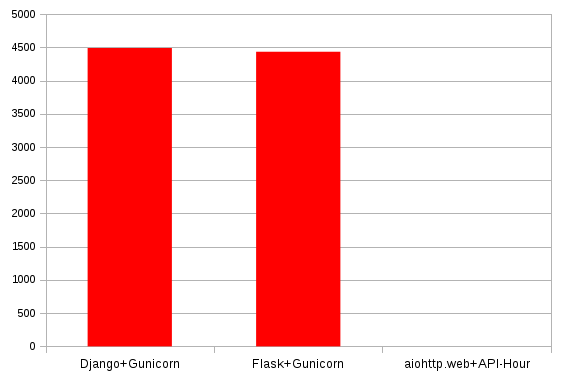
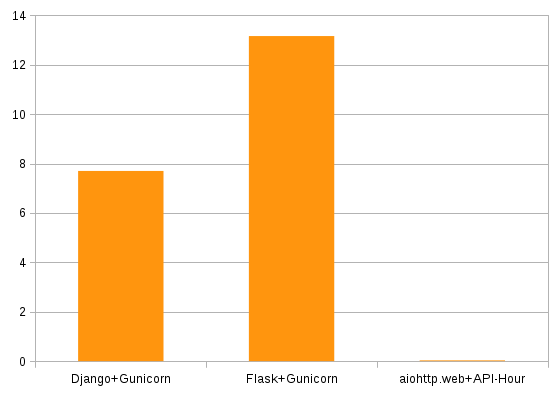
In each daemon folder in benchmarks repository, you can read the output result of each wrk.To simplify the reading, I summarize the captured values with an array and graphs:
| Requests/s | Errors | Avg Latency (s) | |
| Django+Gunicorn | 70598 | 4489 | 7.7 |
| Flask+Gunicorn | 79598 | 4433 | 13.16 |
| aiohttp.web+API-Hour | 395847 | 0 | 0.03 |
 |
| Requests by seconds (Higher is better) |
 |
| Errors (Lower is better) |
 |
| Latency (s) (Lower is better) |
Agents list from database
| Requests/s | Errors | Avg Latency (s) | |
| Django+Gunicorn | 583 | 2518 | 0.324 |
| Django ORM+Gunicorn | 572 | 2798 | 0.572 |
| Flask+Gunicorn | 634 | 2985 | 13.16 |
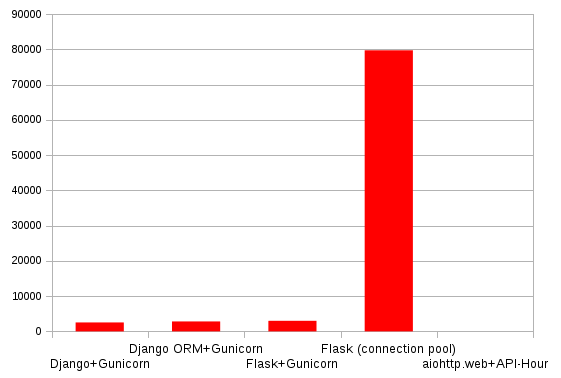
| Flask (connection pool) | 2535 | 79704 | 12.09 |
| aiohttp.web+API-Hour | 4179 | 0 | 0.098 |
 |
| Requests by seconds (Higher is better) |
 |
| Errors (Lower is better) |
 |
| Latency (s) (Lower is better) |
Conclusions for the next round
On high charge, Django doesn't have the same behaviour as Flask: Both handle more or less the same requests rate, but Django penalizes less global latency of HTTP queries. The drawback is that the slow HTTP queries are very slow (26,43s for Django compared to 13,31s for Flask).I removed Django ORM test for the next round because it isn't exactly the same SQL query generated and the performance difference with a SQL query is negligible.
I removed also Flask DB connection pool because the error rate is too important compared to other tests.
Second round
Here, I use wrk2, and changed the run time to 5 minutes.A longer run time is very important because of how resources availability can change with time.
There are at least two reasons for this:
1. Your test environment runs on top of some OS which continues its activity during the test.
Therefore, you need a long time to be more insensitive to transient use of your test machine resources by other things
like another OS daemon or cron job triggering meanwhile.
2. The ramp-up of your test will gradually consume more resources at different levels: at the level of your Python scripts & libs,
as well as at the level of you OS / (Virtual) Machine.
This decrease of available resources will not necessarily be instantaneous, nor linear.
This is a typical source of after-deployment bad surprises in prod.
Here too, to be as close as possible to production scenario, you need to give time to your test to arrive to a "hover", eventually saturating some resources.
Ideally you'd saturate the network first (which in this case is like winning the jackpot).
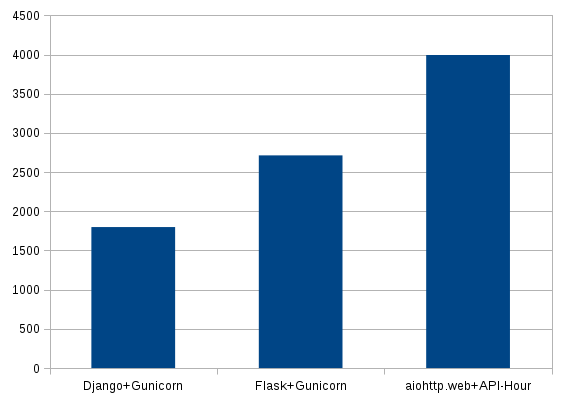
Here, I'm testing at a constant 4000 queries per second, this time through the network.
Simple JSON document
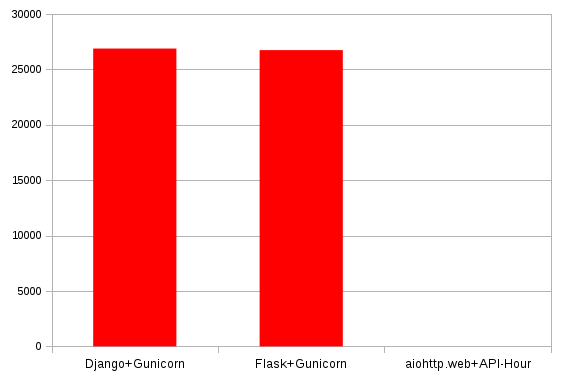
| Requests/s | Errors | Avg Latency (s) | |
| Django+Gunicorn | 1799 | 26883 | 97 |
| Flask+Gunicorn | 2714 | 26742 | 52 |
| aiohttp.web+API-Hour | 3995 | 0 | 0.002 |
 |
| Requests by seconds (Higher is better) |
 |
| Errors (Lower is better) |
 |
| Latency (s) (Lower is better) |
Agents list from database
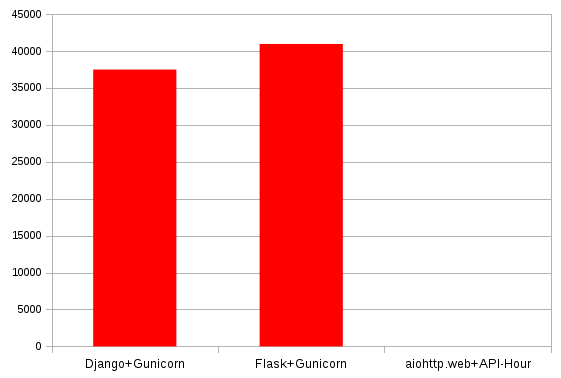
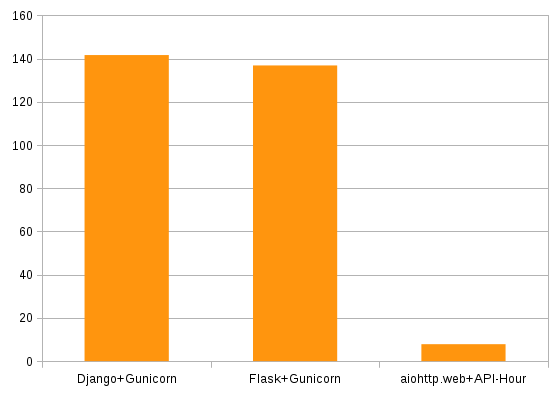
| Requests/s | Errors | Avg Latency (s) | |
| Django+Gunicorn | 278 | 37480 | 141.6 |
| Flask+Gunicorn | 304 | 40951 | 136.8 |
| aiohttp.web+API-Hour | 3698 | 0 | 7.84 |
 |
| Requests by seconds (Higher is better) |
 |
| Errors (Lower is better) |
 |
| Latency (s) (Lower is better) |
(Extra) Third round
For the fun, I used the same setup as second round, but with only with 10 requests/seconds during 30 seconds to see if under a low load, sync daemons could be quicker, because you have the AsyncIO overhead.Agents list from database
| Requests/s | Errors | Avg Latency (s) | |
| Django+Gunicorn | 10 | 0 | 0.01936 |
| Flask+Gunicorn | 10 | 0 | 0.01874 |
| aiohttp.web+API-Hour | 10 | 0 | 0.00642 |
 |
| Latency (s) (Lower is better) |
Conclusion
AsyncIO with aiohttp.web and API-Hour increases the number of requests per second, but more importantly, you have no sockets nor 5XX errors and the waiting time for each user is very really better, even with low load. This benchmark uses an ideal network setup, and therefore it doesn't cover a much worse scenario where your client arrives over a slow network (think smartphone users) on your Website.
It has been said often: If your webapp is your business, reduce waiting time is a key winner for you:
Some clues to improve AsyncIO performances
Even if this looks like good performance, we shouldn't rest on our laurels, we can certainly find more optimizations:
- Use an alternative event loop: I've tested to replace AsyncIO event loop and network layer by aiouv and quamash. For now, it doesn't really have a huge impact, maybe in the future.
- Have multiplex protocols from frontend to backend: HTTP 2 is now a multiplex protocol, it means you can stack several HTTP queries without waiting for the first response. This pattern should increase AsyncIO performances, but it must be validated by a benchmark.
- If you have another idea, don't hesitate to post it in comments.
Don't take architectural decisions based on micro-benchmarks
It's important to be very cautious with benchmarks, especially with micro-benchmarks. Check several different benchmarks, using different scenari, before to conclude on architecture for your application.
Don't forget this is all about IO-bound
If I was working for an organisation with a lot of CPU-bound projects, (such as a scientific organisation for example), my speech would be totally different.
But, my day-to-day challenges are more about I/O than about CPU, probably like for most Web developers.
Don't simply take me as a mentor. The needs and problematics of one person or organisation are not necessarily the same as your, even if that person is considered as a "guru" in one opensource community or another.
We should all try to keep a rational, scientific approach instead of religious approach when selecting your tools.
I hope this post will give you some ideas to experiment with. Feel free to share your tips to increase performances, I'd be glad to include them in my benchmarks!
I hope that these benchmarks will be an eye-opener for you.