Introduction
Love it or loathe it, PowerPoint is widely used in most business settings. This article will not debate the merits of PowerPoint but will show you how to use python to remove some of the drudgery of PowerPoint by automating the creation of PowerPoint slides using python.
Fortunately for us, there is an excellent python library for creating and updating PowerPoint files: python-pptx. The API is very well documented so it is pretty easy to use. The only tricky part is understanding the PowerPoint document structure including the various master layouts and elements. Once you understand the basics, it is relatively simple to automate the creation of your own PowerPoint slides. This article will walk through an example of reading in and analyzing some Excel data with pandas, creating tables and building a graph that can be embedded in a PowerPoint file.
PowerPoint File Basics
Python-pptx can create blank PowerPoint files but most people are going to prefer working with a predefined template that you can customize with your own content. Python-pptx’s API supports this process quite simply as long as you know a few things about your template.
Before diving into some code samples, there are two key components you need to understand: Slide Layouts and Placeholders. In the images below you can see an example of two different layouts as well as the template’s placeholders where you can populate your content.
In the image below, you can see that we are using Layout 0 and there is one placeholder on the slide at index 1.

In this image, we use Layout 1 for a completely different look.

In order to make your life easier with your own templates, I created a simple standalone script that takes a template and marks it up with the various elements.
I won’t explain all the code line by line but you can see analyze_ppt.py on github. Here is the function that does the bulk of the work:
defanalyze_ppt(input,output):""" Take the input file and analyze the structure. The output file contains marked up information to make it easier for generating future powerpoint templates."""prs=Presentation(input)# Each powerpoint file has multiple layouts# Loop through them all and see where the various elements areforindex,_inenumerate(prs.slide_layouts):slide=prs.slides.add_slide(prs.slide_layouts[index])# Not every slide has to have a titletry:title=slide.shapes.titletitle.text='Title for Layout {}'.format(index)exceptAttributeError:print("No Title for Layout {}".format(index))# Go through all the placeholders and identify them by index and typeforshapeinslide.placeholders:ifshape.is_placeholder:phf=shape.placeholder_format# Do not overwrite the title which is just a special placeholdertry:if'Title'notinshape.text:shape.text='Placeholder index:{} type:{}'.format(phf.idx,shape.name)exceptAttributeError:print("{} has no text attribute".format(phf.type))print('{} {}'.format(phf.idx,shape.name))prs.save(output)The basic flow of this function is to loop through and create an example of every layout included in the source PowerPoint file. Then on each slide, it will populate the title (if it exists). Finally, it will iterate through all of the placeholders included in the template and show the index of the placeholder as well as the type.
If you want to try it yourself:
python analyze_ppt.py simple-template.ppt simple-template-markup.ppt
Creating your own PowerPoint
For the dataset and analysis, I will be replicating the analysis in Generating Excel Reports from a Pandas Pivot Table. The article explains the pandas data manipulation in more detail so it will be helpful to make sure you are comfortable with it before going too much deeper into the code.
Let’s get things started with the inputs and basic shell of the program:
from__future__importprint_functionfrompptximportPresentationfrompptx.utilimportInchesimportargparseimportpandasaspdimportnumpyasnpfromdatetimeimportdateimportmatplotlib.pyplotaspltimportseabornassns# Functions go hereif__name__=="__main__":args=parse_args()df=pd.read_excel(args.report.name)report_data=create_pivot(df)create_chart(df,"report-image.png")create_ppt(args.infile.name,args.outfile.name,report_data,"report-image.png")After we create our command line args, we read the source Excel file into a pandas DataFrame. Next, we use that DataFrame as an input to create the Pivot_table summary of the data:
defcreate_pivot(df,index_list=["Manager","Rep","Product"],value_list=["Price","Quantity"]):""" Take a DataFrame and create a pivot table Return it as a DataFrame pivot table"""table=pd.pivot_table(df,index=index_list,values=value_list,aggfunc=[np.sum,np.mean],fill_value=0)returntableConsult the Generating Excel Reports from a Pandas Pivot Table if this does not make sense to you.
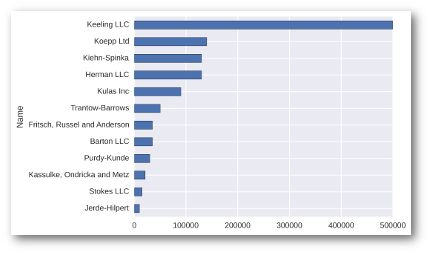
The next piece of the analysis is creating a simple bar chart of sales performance by account:
defcreate_chart(df,filename):""" Create a simple bar chart saved to the filename based on the dataframe passed to the function"""df['total']=df['Quantity']*df['Price']final_plot=df.groupby('Name')['total'].sum().order().plot(kind='barh')fig=final_plot.get_figure()# Size is the same as the PowerPoint placeholderfig.set_size_inches(6,4.5)fig.savefig(filename,bbox_inches='tight',dpi=600)Here is a scaled down version of the image:
We have a chart and a pivot table completed. Now we are going to embed that information into a new PowerPoint file based on a given PowerPoint template file.
Before I go any farther, there are a couple of things to note. You need to know what
layout you would like to use as well as where you want to populate your content.
In looking at the output of
analyze_ppt.py
we know that the title slide
is layout 0 and that it has a title attribute and a subtitle at placeholder 1.
Here is the start of the function that we use to create our output PowerPoint:
defcreate_ppt(input,output,report_data,chart):""" Take the input powerpoint file and use it as the template for the output file."""prs=Presentation(input)# Use the output from analyze_ppt to understand which layouts and placeholders# to use# Create a title slide firsttitle_slide_layout=prs.slide_layouts[0]slide=prs.slides.add_slide(title_slide_layout)title=slide.shapes.titlesubtitle=slide.placeholders[1]title.text="Quarterly Report"subtitle.text="Generated on {:%m-%d-%Y}".format(date.today())This code creates a new presentation based on our input file, adds a single slide and populates the title and subtitle on the slide. It looks like this:

Pretty cool huh?
The next step is to embed our picture into a slide.
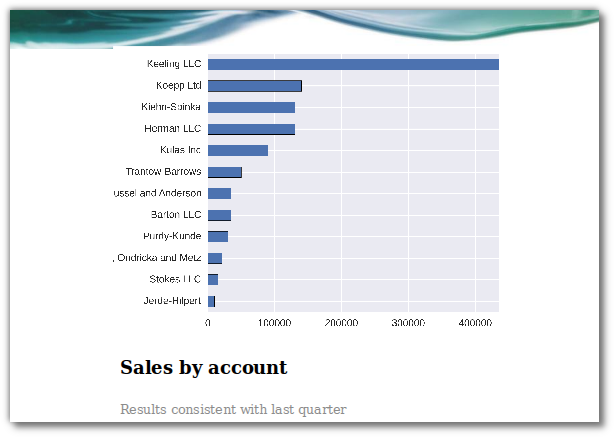
From our previous analysis, we know that the graph slide we want to use is layout index 8, so we create a new slide, add a title then add a picture into placeholder 1. The final step adds a subtitle at placeholder 2.
# Create the summary graphgraph_slide_layout=prs.slide_layouts[8]slide=prs.slides.add_slide(graph_slide_layout)title=slide.shapes.titletitle.text="Sales by account"placeholder=slide.placeholders[1]pic=placeholder.insert_picture(chart)subtitle=slide.placeholders[2]subtitle.text="Results consistent with last quarter"Here is our masterpiece:
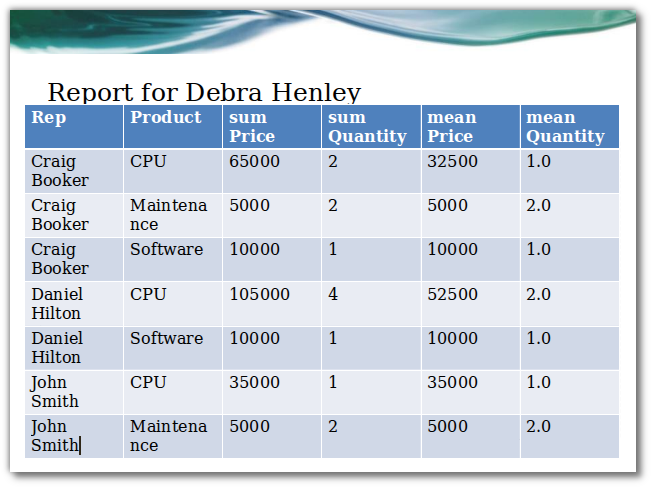
For the final portion of the presentation, we will create a table for each manager with their sales performance.
Here is an image of what we’re going to achieve:
Creating tables in PowerPoint is a good news / bad news story. The good news is that there is an API to create one. The bad news is that you can’t easily convert a pandas DataFrame to a table using the built in API. However, we are very fortunate that someone has already done all the hard work for us and created PandasToPowerPoint.
This excellent piece of code takes a DataFrame and converts it to a PowerPoint compatible table. I have taken the liberty of including a portion of it in my script. The original has more functionality that I am not using so I encourage you to check out the repo and use it in your own code.
# Create a slide for each managerformanagerinreport_data.index.get_level_values(0).unique():slide=prs.slides.add_slide(prs.slide_layouts[2])title=slide.shapes.titletitle.text="Report for {}".format(manager)top=Inches(1.5)left=Inches(0.25)width=Inches(9.25)height=Inches(5.0)# Flatten the pivot table by resetting the index# Create a table on the slidedf_to_table(slide,report_data.xs(manager,level=0).reset_index(),left,top,width,height)prs.save(output)The code takes each manager out of the pivot table and builds a simple DataFrame
that contains the summary data. Then uses the
df_to_table
to convert
the DataFrame into a PowerPoint compatible table.
If you want to run this on your own, the full code would look something like this:
python create_ppt.py simple-template.pptx sales-funnel.xlsx myreport.pptx
All of the relevant files are available in the github repository.
Conclusion
One of the things I really enjoy about using python to solve real world business problems is that I am frequently pleasantly surprised at the rich ecosystem of very well thought out python tools already available to help with my problems. In this specific case, PowerPoint is rarely a joy to use but it is a necessity in many environments.
After reading this article, you should know that there is some hope for you next time you are asked to create a bunch of reports in PowerPoint. Keep this article in mind and see if you can find a way to automate away some of the tedium!