Introduction
Whenever I am doing analysis with pandas my first goal is to get data into
a panda’s DataFrame using one of the many available options. For the vast
majority of instances, I use
read_excel
,
read_csv
, or
read_sql
.
However, there are instances when I just have a few lines of data or some calculations
that I want to include in my analysis. In these cases it is helpful to
know how to create DataFrames from standard python lists or dictionaries.
The basic process is not difficult but because there are several different
options it is helpful to understand how each works. I can never remember whether
I should use
from_dict
,
from_records
,
from_items
or the
default
DataFrame
constructor. Normally, through some trial and error,
I figure it out. Since it is still confusing to me, I though I would walk through
several examples below to clarify the different approaches. At the end of the article,
I briefly show how this can be useful when generating Excel reports.
DataFrames from Python Structures
There are multiple methods you can use to take a standard python datastructure and create a panda’s DataFrame. For the purposes of these examples, I’m going to create a DataFrame with 3 months of sales information for 3 fictitious companies.
| account | Jan | Feb | Mar | |
|---|---|---|---|---|
| 0 | Jones LLC | 150 | 200 | 140 |
| 1 | Alpha Co | 200 | 210 | 215 |
| 2 | Blue Inc | 50 | 90 | 95 |
Dictionaries
Before showing the examples below, I am assuming the following imports have been executed:
importpandasaspdfromcollectionsimportOrderedDictfromdatetimeimportdateThe “default” manner to create a DataFrame from python is to use a list of dictionaries. In this case each dictionary key is used for the column headings. A default index will be created automatically:
sales=[{'account':'Jones LLC','Jan':150,'Feb':200,'Mar':140},{'account':'Alpha Co','Jan':200,'Feb':210,'Mar':215},{'account':'Blue Inc','Jan':50,'Feb':90,'Mar':95}]df=pd.DataFrame(sales)| Feb | Jan | Mar | account | |
|---|---|---|---|---|
| 0 | 200 | 150 | 140 | Jones LLC |
| 1 | 210 | 200 | 215 | Alpha Co |
| 2 | 90 | 50 | 95 | Blue Inc |
As you can see, this approach is very “row oriented”. If you would like to create
a DataFrame in a “column oriented” manner, you would use
from_dict
sales={'account':['Jones LLC','Alpha Co','Blue Inc'],'Jan':[150,200,50],'Feb':[200,210,90],'Mar':[140,215,95]}df=pd.DataFrame.from_dict(sales)Using this approach, you get the same results as above. The key point to consider is which method is easier to understand in your unique situation. Sometimes it is easier to get your data in a row oriented approach and others in a column oriented. Knowing the options will help make your code simpler and easier to understand for your particular need.
Most of you will notice that the order of the columns looks wrong. The issue is that the standard python dictionary does not preserve the order of its keys. If you want to control column order then there are two options.
First, you can manually re-order the columns:
df=df[['account','Jan','Feb','Mar']]Alternatively you could create your dictionary using python’s
OrderedDict
.
sales=OrderedDict([('account',['Jones LLC','Alpha Co','Blue Inc']),('Jan',[150,200,50]),('Feb',[200,210,90]),('Mar',[140,215,95])])df=pd.DataFrame.from_dict(sales)Both of these approaches will give you the results in the order you would likely expect.
| account | Jan | Feb | Mar | |
|---|---|---|---|---|
| 0 | Jones LLC | 150 | 200 | 140 |
| 1 | Alpha Co | 200 | 210 | 215 |
| 2 | Blue Inc | 50 | 90 | 95 |
For reasons I outline below, I tend to specifically re-order my columns vs. using an OrderedDict but it is always good to understand the options.
Lists
The other option for creating your DataFrames from python is to include the data in a list structure.
The first approach is to use a row oriented approach using pandas
from_records
.
This approach is similar to the dictionary approach but you need to explicitly call out the column labels.
sales=[('Jones LLC',150,200,50),('Alpha Co',200,210,90),('Blue Inc',140,215,95)]labels=['account','Jan','Feb','Mar']df=pd.DataFrame.from_records(sales,columns=labels)The second method is the
from_items
which is column oriented and actually
looks similar to the
OrderedDict
example above.
sales=[('account',['Jones LLC','Alpha Co','Blue Inc']),('Jan',[150,200,50]),('Feb',[200,210,90]),('Mar',[140,215,95]),]df=pd.DataFrame.from_items(sales)Both of these examples will generate the following DataFrame:
| account | Jan | Feb | Mar | |
|---|---|---|---|---|
| 0 | Jones LLC | 150 | 200 | 140 |
| 1 | Alpha Co | 200 | 210 | 215 |
| 2 | Blue Inc | 50 | 90 | 95 |
Keeping the Options Straight
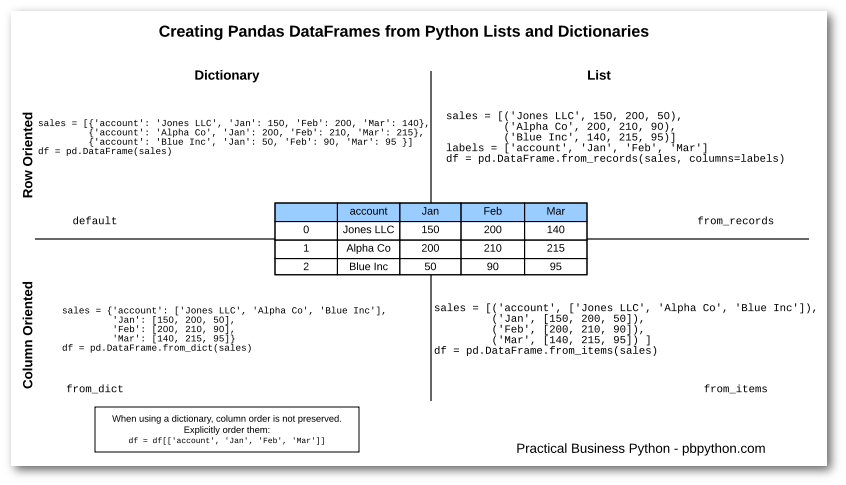
In order to keep the various options clear in my mind, I put together this simple graphic to show the dictionary vs. list options as well as row vs. column oriented approaches. It’s a 2X2 grid so I hope all the consultants are impressed!

For the sake of simplicity, I am not showing the
OrderedDict
approach
because the
from_items
approach is probably a more likely real world solution.
If this is a little hard to read, you can also get the PDF version.
Simple Example
This may seem like a lot of explaining for a simple concept. However, I frequently use these approaches to build small DataFrames that I combine with my more complicated analysis.
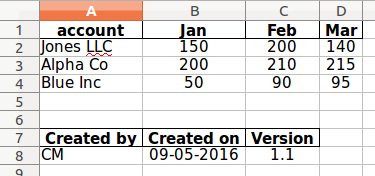
For one example, let’s say we want to save our DataFrame and include a footer so we know when it was created and who it was created by. This is much easier to do if we populate a DataFrame and write it to Excel than if we try to write individual cells to Excel.
Take our existing DataFrame:
sales=[('account',['Jones LLC','Alpha Co','Blue Inc']),('Jan',[150,200,50]),('Feb',[200,210,90]),('Mar',[140,215,95]),]df=pd.DataFrame.from_items(sales)Now build a footer (in a column oriented manner):
fromdatetimeimportdatecreate_date="{:%m-%d-%Y}".format(date.today())created_by="CM"footer=[('Created by',[created_by]),('Created on',[create_date]),('Version',[1.1])]df_footer=pd.DataFrame.from_items(footer)| Created by | Created on | Version | |
|---|---|---|---|
| 0 | CM | 09-05-2016 | 1.1 |
Combine into a single Excel sheet:
writer=pd.ExcelWriter('simple-report.xlsx',engine='xlsxwriter')df.to_excel(writer,index=False)df_footer.to_excel(writer,startrow=6,index=False)writer.save()
The secret sauce here is to use
startrow
to write the footer DataFrame below the
sales DataFrame. There is also a corresponding
startcol
so you can control the column
layout as well. This allows for a lot of flexibility with the basic
to_excel
function.
Summary
Most pandas users quickly get familiar with ingesting spreadsheets, CSVs and SQL data. However, there are times when you will have data in a basic list or dictionary and want to populate a DataFrame. Pandas offers several options but it may not always be immediately clear on when to use which ones.
There is no one approach that is “best”, it really depends on your needs. I tend to like the list based methods because I normally care about the ordering and the lists make sure I preserve the order. The most important thing is to know the options are available so you can be smart about using the simplest one for your specific case.
On the surface, these samples may seem simplistic but I do find that it is pretty common that I use these methods to generate quick snippets of information that can augment or clarify the more complex analysis. The nice thing about data in a DataFrame is that it is very easy to convert into other formats such as Excel, CSV, HTML, LaTeX, etc. This flexibility is really handy for ad-hoc report generation.


