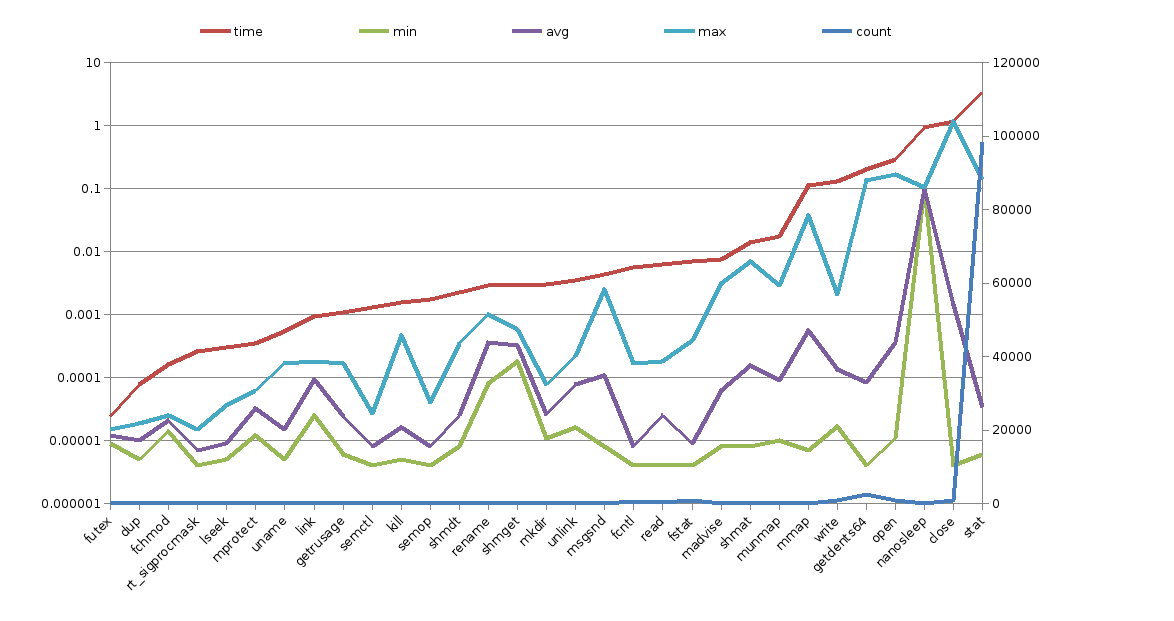
Remember this? Ok,
maybe you never read that. The gist of the post is that I used strace -r -T to
produce some logs that we «amassed[sic] [...] with a python script for generating[sic]
a CSV file [...] and we got a very interesting graph». Mein Gott, sometimes the
English I write is terrible... Here's that graph again:
This post is to announce that that Python script is now public. You can find it
here. It's not as fancy as those flame
graphs you see everywhere else, but it's a good first impression, specially if you have
to wait until the SysAdmin installs perf or any other tool like that (ok, let's be
fair, l/strace is not a standard tool, but probably your grumpy SysAdmin will
be more willing to install those than something more intrusive; I know it happened to
me, at least). It's written in Python3; I'll probably backport it to Python2 soon,
so those stuck with it can still profit from it.
To produce a similar graph, use the --histogram option, then follow the
suggestions spewed to stderr. I hope this helps you solve a problem like it did to
me!
profilingpython
