Introduction
I have written severaltimes about the usefulness of pandas as a data manipulation/wrangling tool and how it can be used to efficiently move data to and from Excel. There are cases, however, where you need an interactive environment for data analysis and trying to pull that together in pure python, in a user-friendly manner would be difficult. This article will discuss how to use xlwings to tie Excel, Python and pandas together to build a data analysis tool that pulls information from an external database, manipulates it and presents it to the user in a familiar spreadsheet format.
A Quick Excel Automation Intro
Excel supports several automation options using VBA. User Defined Functions (UDF) are relatively simple in that they take inputs and returns a single value. The more powerful option is a macro (or procedure) that can automate just about anything Excel can do.
Despite the fact that UDF’s and macros are powerful, they are still written in VBA and there are times when it would be useful to bring the power of python to our Excel-based solution. That’s where xlwings comes into play. At the simplest level, xlwings allows us to glue python and Excel together in two main ways:
- Control Excel from python
- Call custom python code from within Excel
This article will focus on building an Excel worksheet that calls your custom python code.
The Problem
For this example, we are going to develop a simple modeling application that will allow someone to enter an account number and date range then return some summarized sales information that has been transformed via pandas. The solution is simple but shows the power of this combination and how easily you could perform more complex data analysis.
Here’s a diagram of what we are trying to do:
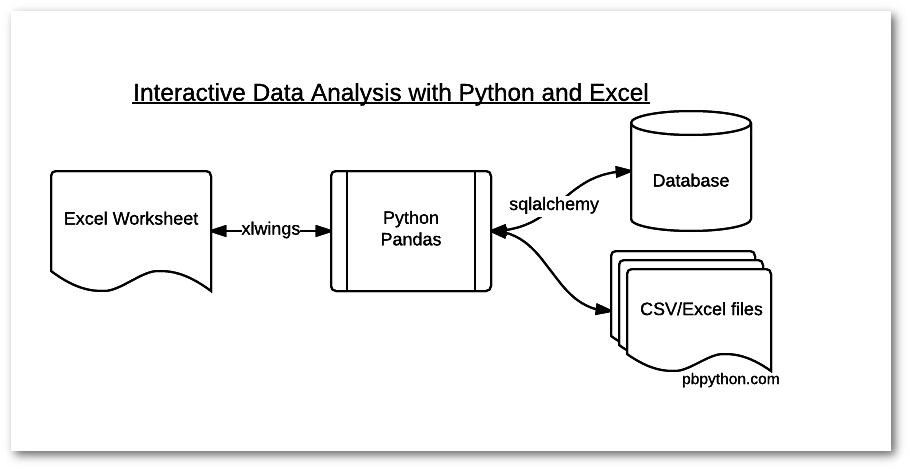
The example shown below could easily be expanded to query multiple databases or interact with any kind of file that python can read (CSV, Excel, json, etc.)
Setting Up The Environment
For the purposes of this article, I will assume you are running the application on a Windows-based system. I highly recommend you use anaconda (or miniconda) as your distro of choice.
The first thing we need to do is install xlwings (assuming python+pandas are already installed):
conda install xlwings
There is a nice xlwings helper function called
quickstart
which will create a sample Excel file
and stub python file for you.
c:\>xlwings quickstart pbp_proj
If you look in the newly created pbp_proj directory, you’ll see two files:
pbp_proj.py
pbp_proj.xlsm
The python file is empty and the Excel file looks empty but there has been some behind the scenes work done to make the excel to python interface easier for you.
To see what is put into the Excel file, open your newly created file in Excel and go into Developer -> Visual Basic and you should see something like this:
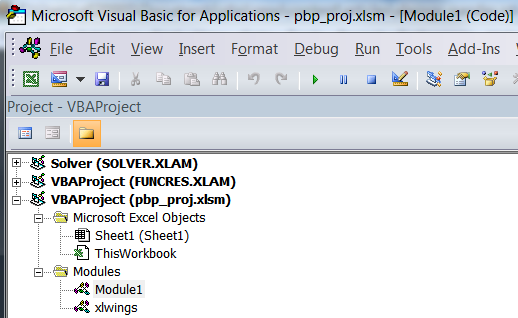
You will notice that there are two modules -
xlwings
and
Module1
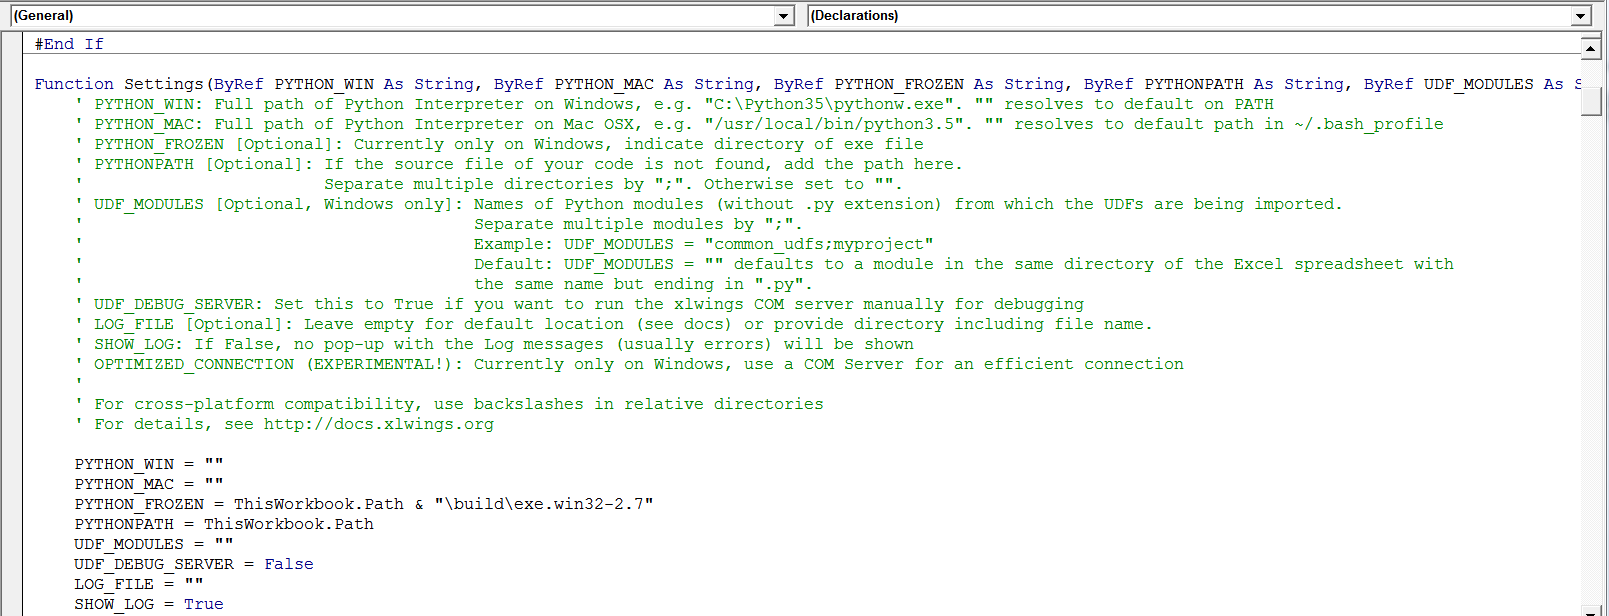
. The xlwings
module includes all the VBA code to make your custom code work. For the most
part you should leave that alone. However, if you have issues with your configuration
(like you can’t find python) then you can update the config information in this section.
The
Module1
will have some default code that looks like this:

We will modify that in a moment to call our custom code. First, I want to create the Excel input fields.
For this application, we are going to allow the user to enter an account number, start date and end date and will manipulate the sales date based on these inputs.
Here is the simple spreadsheet:
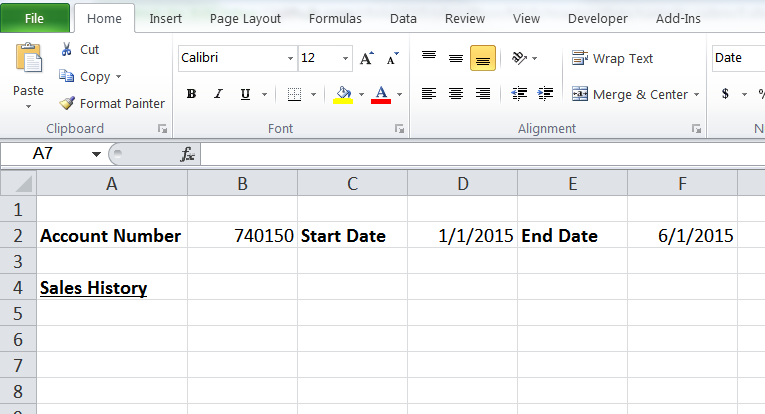
I have only made some minor formatting changes, there are no formulas in the cells. Be sure to save the changes to the Excel file.
For the next step, I’m going to create a short python function that illustrates
how to read data from Excel and write it back. I will be saving this in the
empty file called
pbp_proj.py
importpandasaspdfromxlwingsimportWorkbook,Rangedefsummarize_sales():""" Retrieve the account number and date ranges from the Excel sheet"""# Make a connection to the calling Excel filewb=Workbook.caller()# Retrieve the account number and datesaccount=Range('B2').valuestart_date=Range('D2').valueend_date=Range('F2').value# Output the data just to make sure it all worksRange('A5').value=accountRange('A6').value=start_dateRange('A7').value=end_dateThe program is simple and not very useful at this point. I think it is easier
to develop a skeleton program in order to make sure all the “plumbing” is in place.
The key thing to remember is that the file is called
pbp_proj.py
and the
function is called
summarize_sales
.
To wire this all together, we need to define an Excel procedure to run our code:
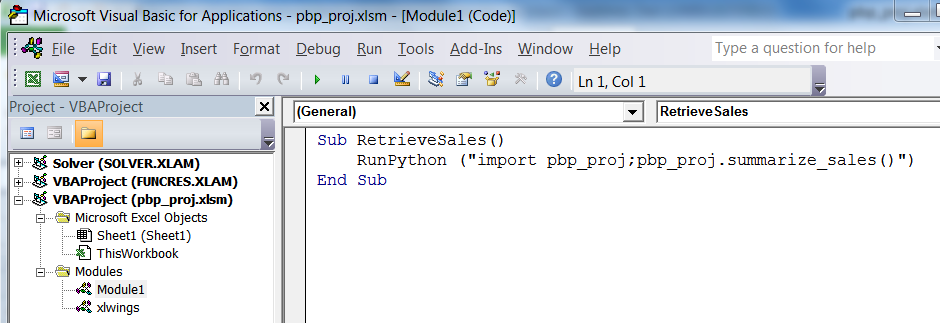
The code is really concise just import the module and execute the function:
Sub RetrieveSales()
    RunPython ("import pbp_proj;pbp_proj.summarize_sales()")
End Sub
The final piece is to add a button to our sheet and assign it to the
procedure/macro
RetrieveSales
.
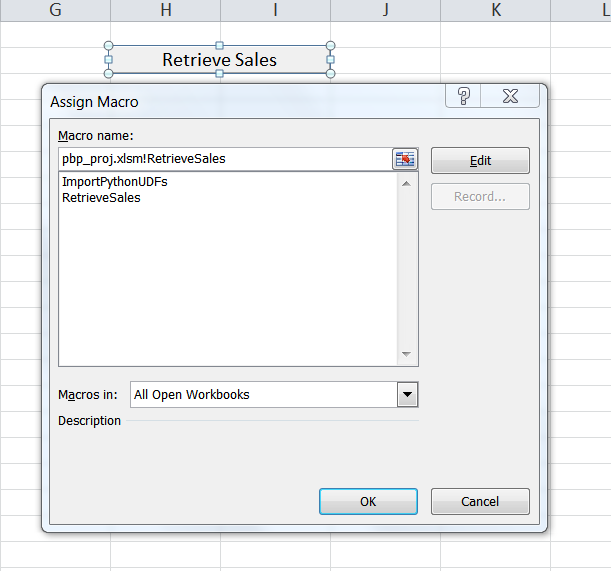
Once you have that in place, you should be able to press the button and see something like this:

The basic process is in place. We can read from Excel into a python program and use that to output data back into Excel. Now, let’s make this a little more useful.
Reading From a Database
For this example, I’m going to use sqlalchemy to query a small sqlite db and read that query directly into a pandas dataframe. The nice thing about this approach is that if you decide that you want to query another database, you can just change the slqlalchemy engine and keep the rest of your code the same. For reference, the xlwings site shows another example that should be helpful as a further reference.
Before proceeding with the code, make sure sqlalchemy is installed:
conda install sqlalchemy
Here is how to connect to the sqlite engine by using the full path to the database:
fromsqlalchemyimportcreate_engine# Connect to sqlite dbdb_file=os.path.join(os.path.dirname(wb.fullname),'pbp_proj.db')engine=create_engine(r"sqlite:///{}".format(db_file))Now that we have the engine, we can construct and execute the query and read the results into a dataframe:
# Create SQL querysql='SELECT * from sales WHERE account="{}" AND date BETWEEN "{}" AND "{}"'.format(account,start_date,end_date)# Read query directly into a dataframesales_data=pd.read_sql(sql,engine)Once we have the data in the
sales_data
dataframe, we can do anything we want with it.
For the sake of simplicity, I will do a simple
groupby
then a
sum
of the total spend:
# Analyze the data however we wantsummary=sales_data.groupby(["sku"])["quantity","ext-price"].sum()total_sales=sales_data["ext-price"].sum()Fortunately xlwings “understands” a pandas dataframe so placing the value back in the Excel sheet is straightforward:
Range('A5').value=summaryRange('E5').value="Total Sales"Range('F5').value=total_salesThat completes the round trip of data from Excel -> Python -> Excel.
Full Program
Here is the fully functioning code included in
pbp_proj.py
importpandasaspdfromsqlalchemyimportcreate_enginefromxlwingsimportWorkbook,Rangeimportosdefsummarize_sales():""" Retrieve the account number and date ranges from the Excel sheet Read in the data from the sqlite database, then manipulate and return it to excel"""# Make a connection to the calling Excel filewb=Workbook.caller()# Connect to sqlite dbdb_file=os.path.join(os.path.dirname(wb.fullname),'pbp_proj.db')engine=create_engine(r"sqlite:///{}".format(db_file))# Retrieve the account number from the excel sheet as an intaccount=Range('B2').options(numbers=int).value# Get our dates - in real life would need to do some error checking to ensure# the correct formatstart_date=Range('D2').valueend_date=Range('F2').value# Clear existing dataRange('A5:F100').clear_contents()# Create SQL querysql='SELECT * from sales WHERE account="{}" AND date BETWEEN "{}" AND "{}"'.format(account,start_date,end_date)# Read query directly into a dataframesales_data=pd.read_sql(sql,engine)# Analyze the data however we wantsummary=sales_data.groupby(["sku"])["quantity","ext-price"].sum()total_sales=sales_data["ext-price"].sum()# Output the resultsifsummary.empty:Range('A5').value="No Data for account {}".format(account)else:Range('A5').options(index=True).value=summaryRange('E5').value="Total Sales"Range('F5').value=total_salesHere is a sample result:
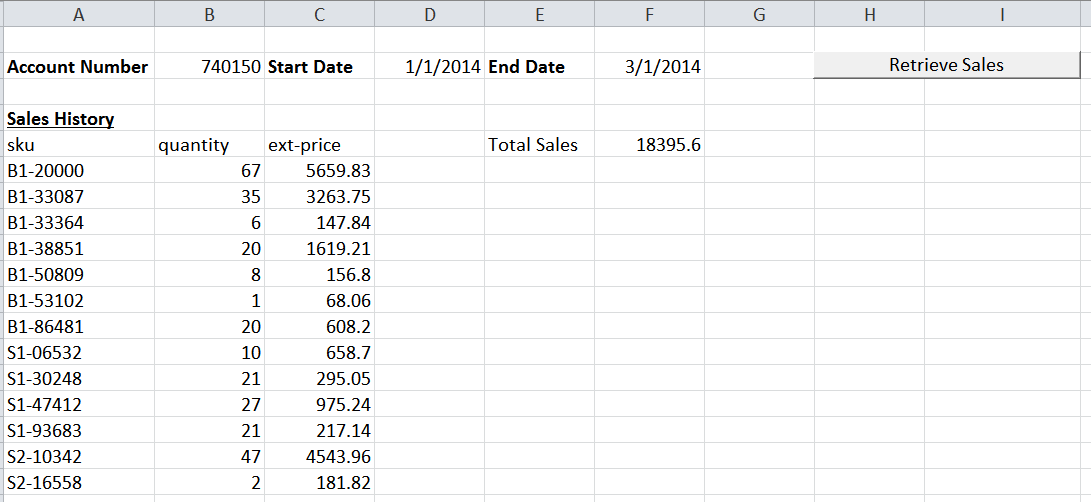
All of the data, including the sqlite db is in my github repo.
Summary
xlwings provides a useful capability to interact seamlessly with Excel from python. By using this code, you can easily build interactive tools for yourself or for less technical users that pull data from multiple sources and analyze it in the very familiar Excel environment. Once the structure is set up, it is really useful to put all your complex logic and data analysis in the python file and harness all the tools available in the python ecosystem. I hope that once you start to play with this, you will find lots of opportunities to use this approach to bring python solutions to some of your less technical users who are stuck using Excel as their only tool for data analysis.