Hello coders!! In this article, we will learn about spectrogram and see how to implement them in Python language from scratch. So, what does it mean? It is a point by point magnitude of the Fourier transform of a segment of an audio signal. Now let us understand the python spectrogram in detail.
Key Points about Python Spectrogram:
- It is an image of the generated signal
- In Y-axis, we plot the time and in X-axis we plot the frequency
- The color of the spectrogram indicates the strength of the signal
- It explains the distribution of the strength of signal at different frequencies
Let us first understand in detail about audio and the various forms of signals
Audio Wave Representation of Spectrogram:
 An Audio Wave
A waveform is a visual representation of an audio signal or soundwave. We can observe the change in amplitude with time. The different axes represent:
- X-axis : Time
- Y-axis : Amplitude
Different Types of Waveforms:
1) Sine Wave:
 Sine Wave
- It is an S-shaped wave
- It oscillates periodically
- Continuous wave
2) square wave:
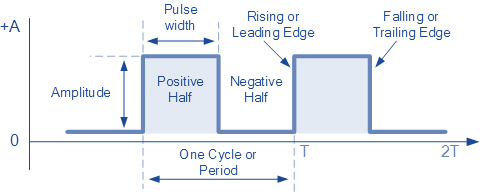 Square Wave
- non-sinusoidal wave
- it is periodic
- instateneous transition between the two levels
3) Triangular Wave:
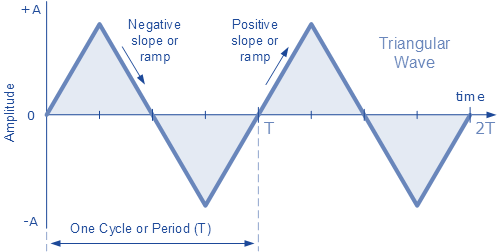 Triangular Wave
- non sinusoidal wave
- periodic in nature
- piecewise linear
- only odd harmonics
Step wise Implementation of Spectrogram in Python:
1)Importing all the Libraries in Python
import os
import matplotlib.pyplot as plt

import librosa
import librosa.display

import IPython.display as ipd
- os – provides a way of using Operating system in a portable way
- matplotlib.pyplot – a collection of functions that make matplotlib work like MATLAB
- librosa – used to do an analysis on any sort of audio
- IPython.display – to display a Python object in all frontends
2) loading the audio
audio_path = "../input/audio/audio/"
audio = os.listdir(audio_path)
listdir() – it is used to return a list of the entries in the directory given by path
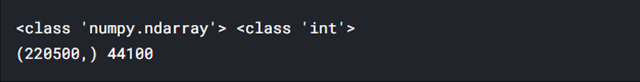
x, sr = librosa.load(audio_path+audio[2], sr=44100)

print(type(x), type(sr))
print(x.shape, sr)
Let us visualize the waveform of the loaded audio in Python:
plt.figure(figsize=(14, 5))
librosa.display.waveplot(x, sr=sr)
 Audio Waveform
librosa.display.waveplot() – Used to plot the amplitude envelope of a waveform
3) Converting the waveform to spectrogram in Python:
X = librosa.stft(x)
Xdb = librosa.amplitude_to_db(abs(X))
plt.figure(figsize=(14, 5))
librosa.display.specshow(Xdb, sr=sr, x_axis='time', y_axis='hz')
plt.colorbar()

- librosa.stft() – STFT stands for Short-time Fourier transform .The STFT computes discrete Fourier transforms (DFT) over short overlapping windows to represent a signal in the time-frequency domain.
- librosa.display.specshow() – displays the spectrogram
Applications of PythonSpectrogram:
- Phonetically identify spoken words
- Analyse the calls of various animals
Must Read
- How to Calculate Square Root in Python
- Python Data Types | Mutable and Immutable Data Types
- Numpy Square Root | Usecase Evaluation of Math Toolkit
- Python Absolute Value | abs() Function With Examples
- Python Collections: Upgraded Version of Built-in Collections?
Conclusion:
In this article, we learned about spectrogram and their implementation in python. We also learned about different types of audio waveforms and saw how to convert the waveform into a spectrogram.
However, if you have any doubts or questions, do let me know in the comment section below. I will try to help you as soon as possible.
Happy Pythoning!
The post Python Spectrogram Implementation in Python from scratch appeared first on Python Pool.